How tree detection from a CHM works
You are viewing in-progress documentation for v2. Switch to the stable version for the current production release.
A canopy height model (CHM) is a raster whose value at every cell is the height of the vegetation top above the ground. Detecting individual trees from it — individual tree detection, or ITD — means turning that continuous height surface into a discrete list of points — one per detected treetop, carrying its location and height. The name promises individual trees, but what a CHM reliably resolves is the canopy-dominant tree at each spot; that gap is the subject of a section below.
This page is about why detection behaves the way it does: what the algorithms look for, what their parameters trade off, and why the same request gives different answers on different CHMs. To run it, see Generate a tree inventory from a CHM; to check its result against your stand and adjust it, see Check and adjust CHM tree detection.
The examples come from the Blackfoot River domain east of Missoula, Montana, used in From lidar to a tree inventory, with a 1 m CHM built from 3DEP lidar.
The input is a height surface
Section titled “The input is a height surface”Everything the detector knows comes from one band. In a CHM built from lidar, each 1 m cell holds the highest return that landed in it, less the ground height. Bare ground sits near zero; tree crowns rise as mounds.
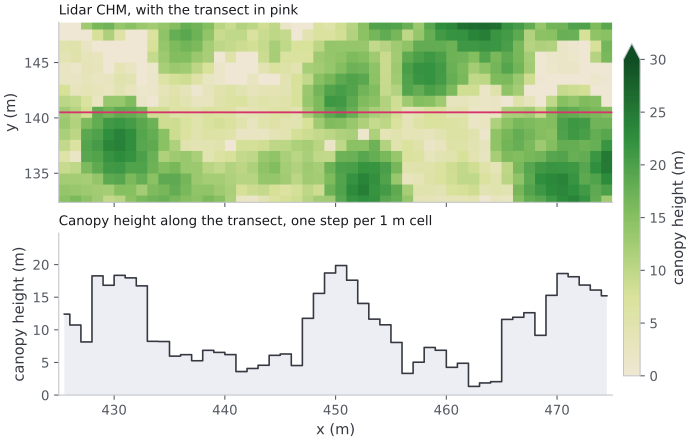
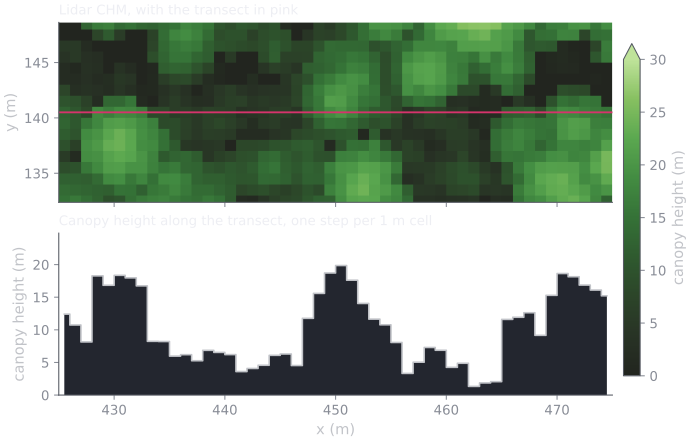
A strip of the Blackfoot River lidar CHM and the height along the pink transect. Three crowns of 18–20 m stand above lower vegetation.
A CHM is a surface, not a set of stems. It does not record where one tree ends and the next begins, how many trunks produced a clump of foliage, or what species any of it is. Its crowns are not smooth domes either: each cell keeps whichever return was highest, so a crown’s top is rough, and the left crown in the profile has two summits 2 m apart. Detection has to infer discrete trees from the shape of this surface, and every choice below follows from that.
A treetop is a local maximum
Section titled “A treetop is a local maximum”The working assumption of CHM-based detection is simple: the top of a tree is a high point that is taller than everything immediately around it. Walk a window across the raster; wherever the center cell is the tallest cell in its window, call that a treetop and record a tree there.
Two parameters fall directly out of that picture:
- A height floor (
min_height). Below some height, bumps in the surface are shrubs, stumps, or noise rather than trees you want in the inventory. Cells under the floor are ignored, so detection never fires on them. - A search window. “Immediately around it” has to be made precise. The window size sets how far apart two peaks must be to count as two trees. This is the parameter with the most leverage, and it is where the two algorithms part ways.
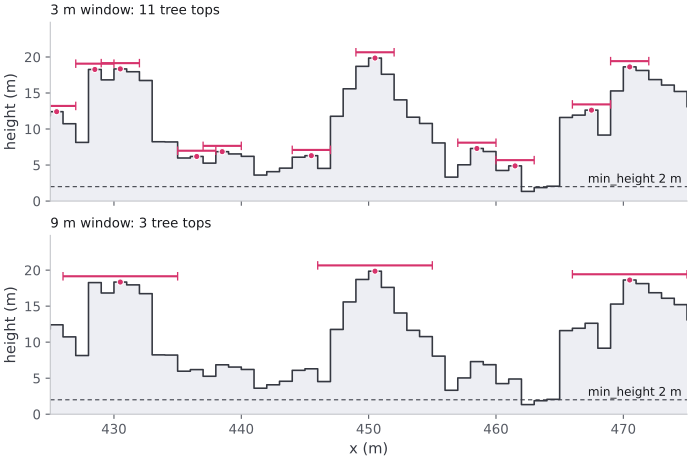
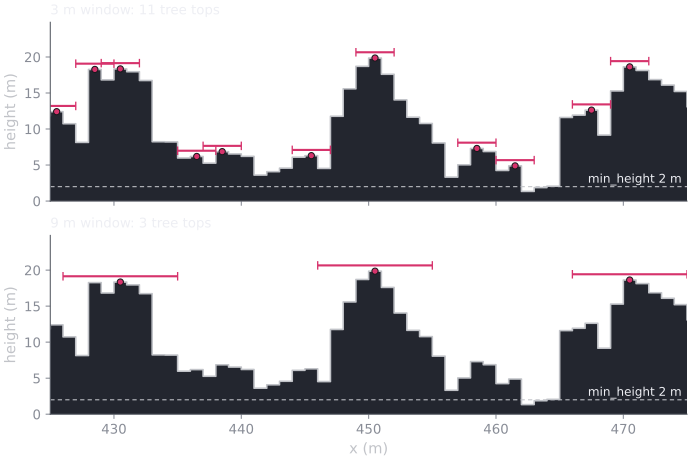
The local-maximum rule along the transect above, with a 3 m and a 9 m window. Each bar is a treetop’s window: no cell under it is taller than the treetop. For illustration this applies the rule along one line; the API applies it over a disk of cells.
Look at what the 3 m window finds besides the three crowns: a second summit on
the left crown, a shoulder on the right one, and five bumps of 5–7 m in the
vegetation between them. Whether those bumps are small trees or shrubs, the
height surface cannot say; only min_height decides whether they count. The
9 m window finds the three crowns and nothing else.
The over- versus under-detection trade-off
Section titled “The over- versus under-detection trade-off”footprint_size, the window of the fixed-window algorithm, is the dial between
two failure modes. A small window asks only that a cell beat its nearest
neighbors, so it finds many peaks — including secondary bumps on a single broad
crown, which show up as extra, spurious trees (over-detection). A large
window forces peaks to be far apart, so a shorter tree within the window of a
taller neighbour is never counted, and stems go missing
(under-detection).
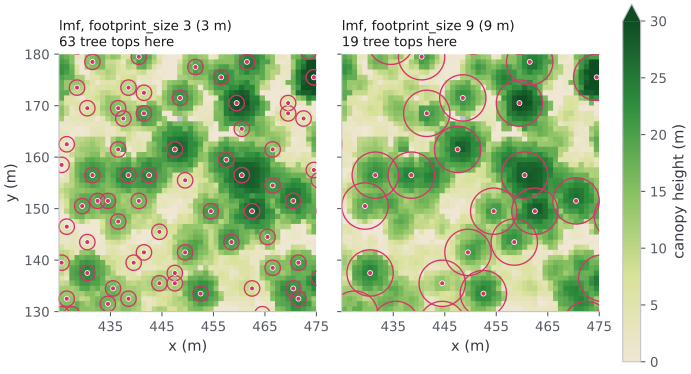
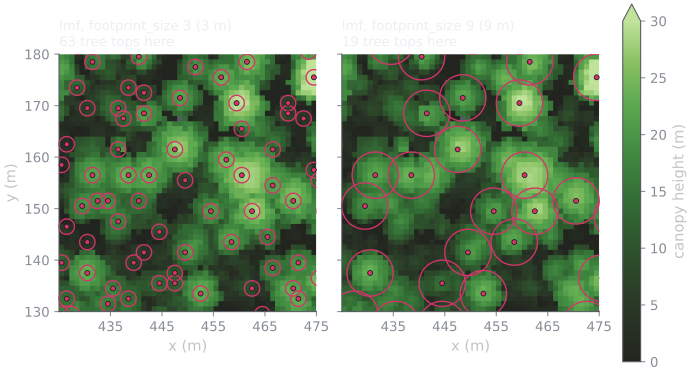
The same trade-off in two dimensions, over a 50 m close-up of the Blackfoot
River lidar CHM that contains the transect. Each ring is a treetop’s window,
to scale. footprint_size 3 (3 m) places 63 treetops here; footprint_size
9 (9 m) places 19. Across the domain the totals are 9,248 and 2,961.
There is no universally correct setting, because the right window is the one that matches the spacing of the trees actually on the ground — and that varies by species, age, and density. It cannot be known from the CHM alone, which is why detection settings are checked against the stand rather than chosen in advance; Check and adjust CHM tree detection does that.
Fixed versus variable windows
Section titled “Fixed versus variable windows”The local maxima filter (lmf) uses a fixed window — a footprint_size
that is the same everywhere on the raster. It is simple and predictable: every
peak is judged against a neighborhood of identical size.
The variable window filter (vwf) makes the window size a function of
canopy height: tall cells are tested against a wider window, short cells
against a narrower one. The motivation is biological — a 30 m tree has a much
wider crown than a 5 m sapling, so the distance to its nearest distinct
neighbor scales with its height. A single fixed window cannot be right for both
at once: sized for the big trees it merges the small ones, sized for the small
trees it splits the big ones. VWF tries to track that relationship instead of
committing to one width.
Concretely the window is a straight line in height —
crown_offset + crown_ratio × height — so vwf is not one window but a
family of them. crown_offset is the width at zero height (the intercept);
crown_ratio is how steeply the window grows with the canopy (the slope).
Choosing a vwf window means choosing that slope and intercept, and the slope
has real leverage: too shallow a crown_ratio keeps the window narrow even
under tall trees and over-detects, while a steeper one widens the window for
the overstory and merges closely-spaced peaks.
The line is not the whole story, because a window is made of cells. The API
turns each diameter into a whole, odd number of cells, at least 3, so on a real
grid the line becomes a staircase. On a 1 m grid the defaults (crown_offset
3 m, crown_ratio 0.05) give just two windows: 3 m where the canopy is under
20 m, and 5 m above it.
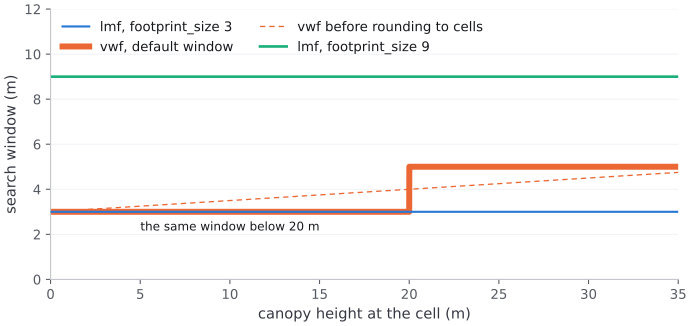
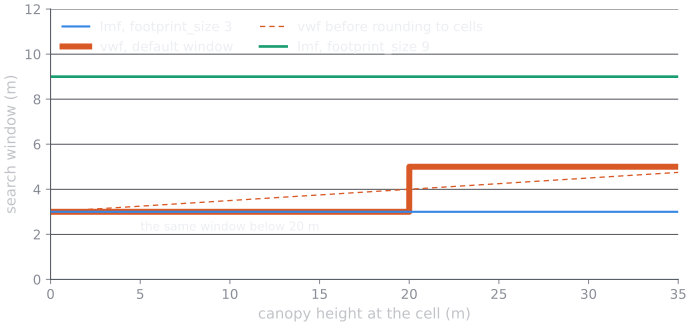
The search window each setting uses at each canopy height on a 1 m grid.
So below 20 m, vwf with its defaults is lmf with footprint_size 3. On
Blackfoot River, 87% of the lmf treetops are under 20 m, and the two detect
9,248 and 9,012 trees. The staircase also moves with the grid: on a 0.6 m NAIP
grid the same defaults step at 12 m, from 3.0 m to 4.2 m.
Neither algorithm is automatically correct. Which one matches the real stand depends on how uniform the canopy is: in an even-aged plantation a fixed window is often plenty, while in a mixed-age stand with both overstory and regeneration a height-scaled window usually separates crowns more faithfully — provided its slope and intercept are set for that stand.
Why the source changes the count
Section titled “Why the source changes the count”The same detection request gives a different inventory on a CHM from a
different source. Blackfoot River has both a NAIP CHM at 0.6 m and the lidar
CHM at 1 m; detect on each with identical parameters (lmf,
footprint_size 3, min_height 2 m):
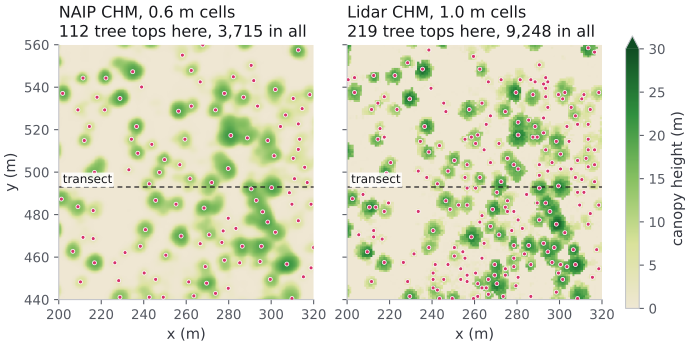
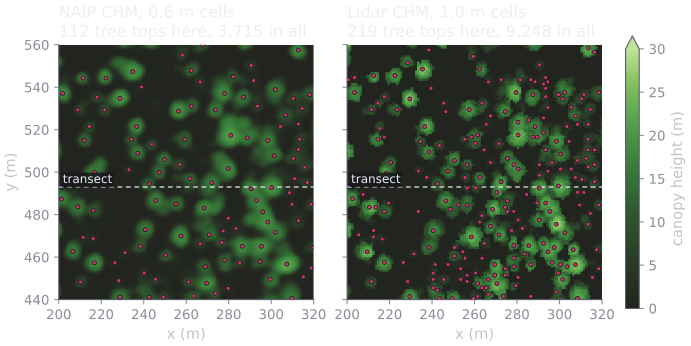
The same 120 m stand. NAIP detects 3,715 treetops across the domain; the lidar CHM detects 9,248, 2.5× more, from the same request body. The dashed line is the transect profiled below.
The reason is visible in the panels. NAIP is a modeled surface: a network predicts a height for every pixel, and it predicts smoothly, so a crown is a round mound with one summit. The lidar CHM is a measurement: each cell holds the tallest return that happened to land in it, so a crown is a rough cluster of peaks and troughs. A local-maxima filter counts summits, and one of these surfaces has far more of them.
That roughness is measurable. Over canopy cells, in a matched 3 m ground window, the mean local height standard deviation is 1.7 m for NAIP and 2.9 m for the lidar CHM.
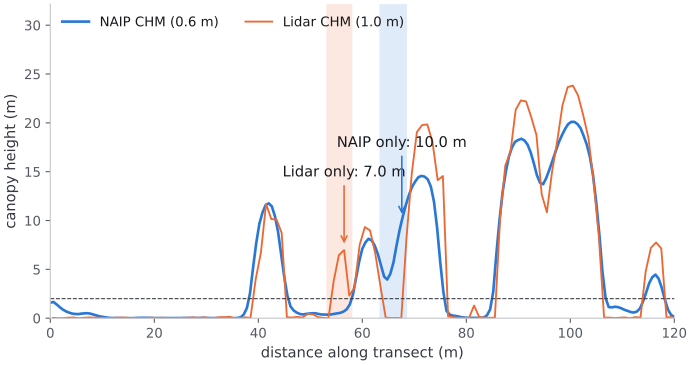
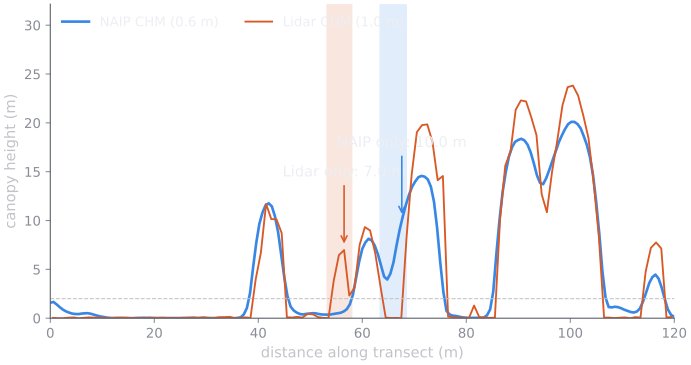
The transect marked in the stand above. The lidar CHM reads taller on the same crowns, 23.8 m against 20.1 m on the tallest, and the two sources disagree outright twice in 120 m, in both directions.
It is not just the cell size
Section titled “It is not just the cell size”footprint_size is measured in pixels, so the same number is a different
distance on the ground: 3 px is 1.8 m on a 0.6 m NAIP grid and 3.0 m on a 1 m
lidar grid. That matters, but correcting for it does not close the gap.
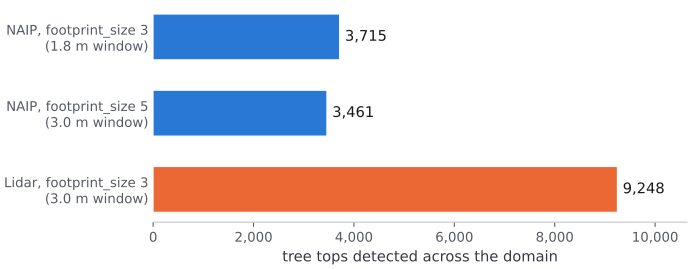
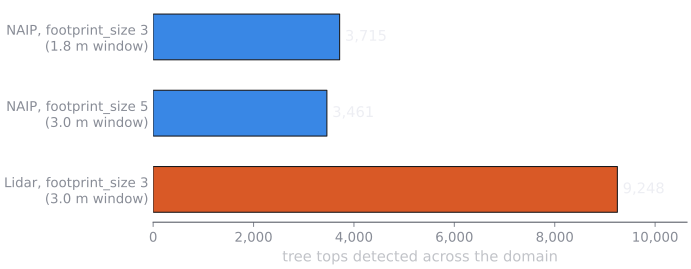
Widening NAIP’s footprint to 5 px matches the lidar run’s 3 m search window and drops NAIP to 3,461, still 2.7× fewer than the lidar CHM. The difference is in the surfaces, not only in the lattice.
Nor is the gap confined to short vegetation that one source resolves and the other smooths away. Every height band gains:
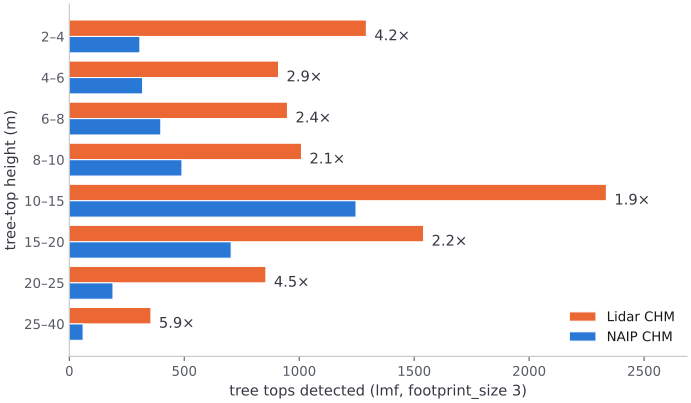
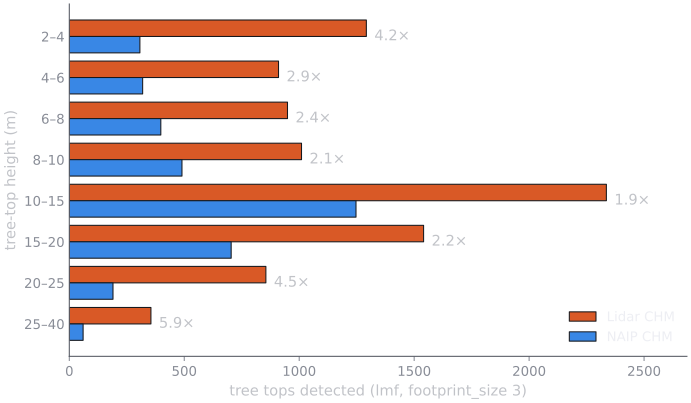
Detected treetops by height. The gap is widest at both ends: 4.2× among 2–4 m treetops, and 5.9× above 25 m, where NAIP’s modeled surface rarely reaches. Its 99th percentile canopy height is 24.3 m, against 28.3 m for the lidar CHM.
Neither count is the true stem count. The lidar CHM’s 175 detections per hectare include detections on low vegetation and on a power line, and NAIP’s smoothing hides real stems. What the comparison shows is that detection settings belong to a surface: parameters that fit one CHM are a different question on another, and stem counts from two sources cannot be compared.
Detection resolves the dominant canopy
Section titled “Detection resolves the dominant canopy”Tuning governs the visible peaks, but a CHM has a deeper, untunable limit: it records the top of the canopy well and everything beneath it poorly. A surface seen from above is the crown exposed to the sky; a smaller tree growing under that crown leaves little or no mark on it. So a detected point is best read not as “a tree” but as the canopy-dominant tree at that spot, plus whatever it hides — the unit forestry calls a tree-approximate object.
Two consequences shape how you should read the result:
- Subordinate trees are systematically missed. Detection rate rises roughly with a tree’s height relative to its neighbors, so the understory is largely invisible. The miss rate grows with stand density — denser canopy hides more of what is below it — and in structurally complex stands it is large: studies in dense mixed-conifer forests report a median near two-thirds of stems omitted.
- A detected count is not a stem count. The missed trees are real but unseen, so the number of detections undercounts the true stems, worst exactly where the canopy is densest. Treat detections as a map of dominant crowns, not as a census of stand density.
In an open, even-aged stand one detection ≈ one tree and this barely bites; in a multi-storied or dense stand it bites hard. The detection is still the best available map of the overstory — it just is not the whole forest.
What a CHM can and cannot tell you
Section titled “What a CHM can and cannot tell you”Because detection reads only height, a CHM-derived inventory carries only what
height can support: each tree’s x, y, and height. It does not carry
species or diameter at breast height — a surface seen from above never observed
the trunk, and nothing in the height field distinguishes a pine from a fir of
the same height.
It also reads only the top of the canopy, not its vertical profile. The height field carries no canopy base height, no bulk density, and no ladder fuels — the sub-canopy structure that carries a surface fire up into the crowns. In fire-behavior terms a CHM constrains crown-fire spread, which the overstory drives, but is silent on crown-fire initiation, which the sub-canopy drives. A CHM-derived inventory is a canopy layer, not a complete fuel column.
This is the core trade-off between the two inventory sources. A CHM gives you the actual canopy surface over your domain — overstory crowns where they really stand, with their heights — but only the overstory, and only its geometry. TreeMap gives you a fuller attribute set — species, DBH, crown ratio — but drawn from a model of what stands like yours typically contain. (NAIP’s CHM is itself a deep-learning estimate from imagery, not a direct measurement, so it carries its own height error — but it is anchored to your specific location.) Choose by what your simulation needs: faithful overstory geometry, or per-tree species and diameter.
Where to go next
Section titled “Where to go next”- Generate a tree inventory from a CHM — the endpoints, parameters, and a runnable two-step script.
- Check and adjust CHM tree detection — compare candidate settings on your own CHM and choose one.
- Build a CHM from a point cloud — the lidar CHM used on this page.
- Generate a tree inventory from TreeMap — the species-and-diameter alternative.
- Fetch and stream the inventory data — read the detected treetops back out, one by one.