Canopy fuel variables
You are viewing in-progress documentation for v2 (Beta). Switch to the stable version for the current production release.
A canopy fuel grid reports four numbers for every cell. They are canopy bulk
density (cbd), canopy base height (cbh), canopy height (chm), and canopy
cover (cc). They look like measurements of the stand. Two of them are not.
Canopy bulk density and canopy base height are method-defined, not intrinsic properties of a forest. The same trees on the same ground give different values depending on how you define and compute them. The spread across reasonable definitions is large enough to change a crown-fire prediction.
Mast et al. (2026) state this directly for canopy base height. It “is a method-defined variable rather than an intrinsic stand property”, and “divergence among methods is expected and should not be interpreted as error”. The inventory canopy endpoint exposes each choice as its own field and records the resolved choice on the grid. A value never travels without the definition that produced it. This page explains what the variables are, why the two important ones move so much, and how to reason about the choice. The how-to guide covers the request bodies.
The four variables and the crown-fire model
Section titled “The four variables and the crown-fire model”Wildland fire science describes the whole canopy with a small set of variables, because that is what the operational crown-fire model needs (Keane 2015, ch. 4). That model is van Wagner’s (1977). It asks two questions of a stand. Can a surface fire climb into the crowns? Once there, can it spread from crown to crown? Each variable answers one of these questions.
| Variable | What it is | Question it answers |
|---|---|---|
cbh | canopy base height in metres, the bottom of the canopy fuel layer | Initiation. How intense must the surface fire be to reach the crowns? |
cbd | canopy bulk density in kg/m³, burnable canopy fuel per unit canopy volume | Spread. Is the canopy dense enough to carry fire crown to crown? |
chm | canopy height in metres, the top of the canopy | Scales crown-fire intensity |
cc | canopy cover in percent, the vertically projected cover of crowns | Fuel drying and wind reduction under the canopy |
Van Wagner’s model sets a critical surface-fire intensity for crown-fire
initiation. It rises with canopy base height,
I₀ = 0.01 · CBH · (460 + 25.9 · FMC)^1.5. It sets a critical spread rate for
active crowning that falls with canopy bulk density, RAC = 3.0 / CBD
(Keane 2015, eqs. 4.1 and 4.2). A
higher CBH makes a stand harder to ignite into the crowns. A higher CBD makes an
established crown fire easier to sustain. Both constants were fit to
experiments. A constant fit against fuel described one way stays valid only
against fuel described the same way.
Every reading starts from one construction, the canopy fuel profile. It is the
vertical distribution of burnable canopy fuel. Slice the canopy into thin
horizontal layers. Sum each tree’s fuel into the layers its crown spans. Divide
by layer volume. The result is bulk density as a function of height. cbd,
cbh, and chm are all readings of this one profile. All three depend on how
the profile is built and how it is read.
The inputs that build the profile
Section titled “The inputs that build the profile”Before any reading can be taken, the profile has to be built. It is only as determinate as the inputs behind it. Each input is a field on the endpoint. Each one changes the fuel, and therefore every reading, before a CBH or CBD method is applied.
- Biomass allometry (
biomass_source) sets how much crown fuel each tree carries. The national default is NSVB. Brown (1978) is offered because it is the equation set behind FuelCalc and the LANDFIRE canopy layers, so it supports comparison with those products. Different families predict different foliage and branchwood mass from the same tree, which scalescflandcbdup or down. - Available fuel (
available_fuel) sets how much of that biomass burns. It is all foliage plus a fraction of the fine branchwood, as described in the note above. It fixes the magnitude of the burnable pool. - Species inclusion and crown-class adjustment decide which trees count and at what weight. FuelCalc excludes most hardwoods and scales crown weight by a tree’s crown class. FastFuels includes every species at full weight unless told otherwise.
- Minimum tree height decides whether saplings are canopy fuel or surface fuel. FFE-FVS and the original FuelCalc method drop trees under 1.83 m (6 ft). The default keeps them. The lowest trees are what a minimum or low-percentile CBH keys on.
- Vertical distribution (
vertical_distribution) sets the shape of the profile. The fuel can spread uniformly over each crown, or follow the species-specific, top-weighted profiles that Reinhardt et al. (2006) fit from 600 destructively sampled trees. This moves the running-mean peak and the threshold crossings. - Horizontal distribution and crown-width allometry
(
horizontal_distribution,max_crown_radius_source) decide how a tree’s fuel and crown reach output cells. The fuel can spread across the cells the crown projects onto, or fall whole into the stem cell. The crown-width equations size that projection, Purves by default or Crookston-Stage for FuelCalc-compatible cover. These driveccand the horizontal spread ofcbd.
Two grids computed with the same CBH or CBD method can still disagree, because their profiles were built from different inputs. The endpoint records the whole chain on the grid, not only the final method. The reported number is the end of a sequence of choices, and the full sequence is what makes it reproducible.
Canopy base height
Section titled “Canopy base height”Canopy base height is a stand property, not a tree property. An individual tree has a crown base you can measure. A stand does not. Scott & Reinhardt (2001) note that neither the lowest crown base height in a stand nor the average crown base height is likely to represent the stand as a whole. Canopy base height has to be defined. The endpoint offers the two families of definition used in the literature.
The first family is a bulk-density threshold crossing (the
bulk_density_threshold method, the default). Read up the canopy fuel profile.
Take the lowest height where bulk density first exceeds a threshold. Below that
height there is too little fuel to carry fire up. This is the FuelCalc, FFE-FVS,
and LANDFIRE lineage. The threshold is a convention, not a physical constant.
The values in use span more than an order of magnitude, and none rests on
combustion physics.
| Threshold (kg/m³) | Source |
|---|---|
| 0.011 | Scott & Reinhardt (2001), used by FFE-FVS |
| 0.012 | Reinhardt et al. (2006), used by FuelCalc and LANDFIRE, the endpoint default |
| 0.037 | Sando & Wick (1972) |
Cruz & Alexander (2010) survey a wider range still, up to 0.32 kg/m³. Reinhardt et al. (2006) call the FuelCalc threshold “arbitrary and not based on any kind of combustion physics, but it seems to perform well”. Scott & Reinhardt (2001) call their critical density arbitrary, and justify it only because the results agree with visual inspection of the stands. Mast et al. (2026) add that the threshold method measures the density needed for fire to spread horizontally through the canopy. That is a change from van Wagner’s original idea, the height at which fire propagates vertically into the canopy.
The second family is an aggregation of per-tree crown bases (the mean,
percentile, and minimum methods). Take each tree’s own crown base height and
summarize the set. The summary you choose is the definition. Because these are
order statistics of the same trees, they fall in a fixed order. The mean is
highest, then the median, then the 20th percentile, then the minimum. The gap
widens as tree height varies more
(Mast et al. 2026).
meanis van Wagner’s original definition. His initiation model was fit to the mean crown base height of even-aged, single-species pine plots. In a uniform stand the mean represents the stand and matches how the model was built. In a multi-storied stand the mean can hide low trees that carry fire into the canopy.percentileuses the lower tail, commonly the 20th percentile or the first quartile. It is the standard choice for uneven-aged stands, where ladder fuel controls whether fire reaches the crowns rather than the average tree.minimumis the most conservative reading. It reflects the chance that surface fire reaches the canopy at any point in the stand. It suits risk-averse screening and firefighter-safety assessment, where underestimating crown-fire potential is the costly error.
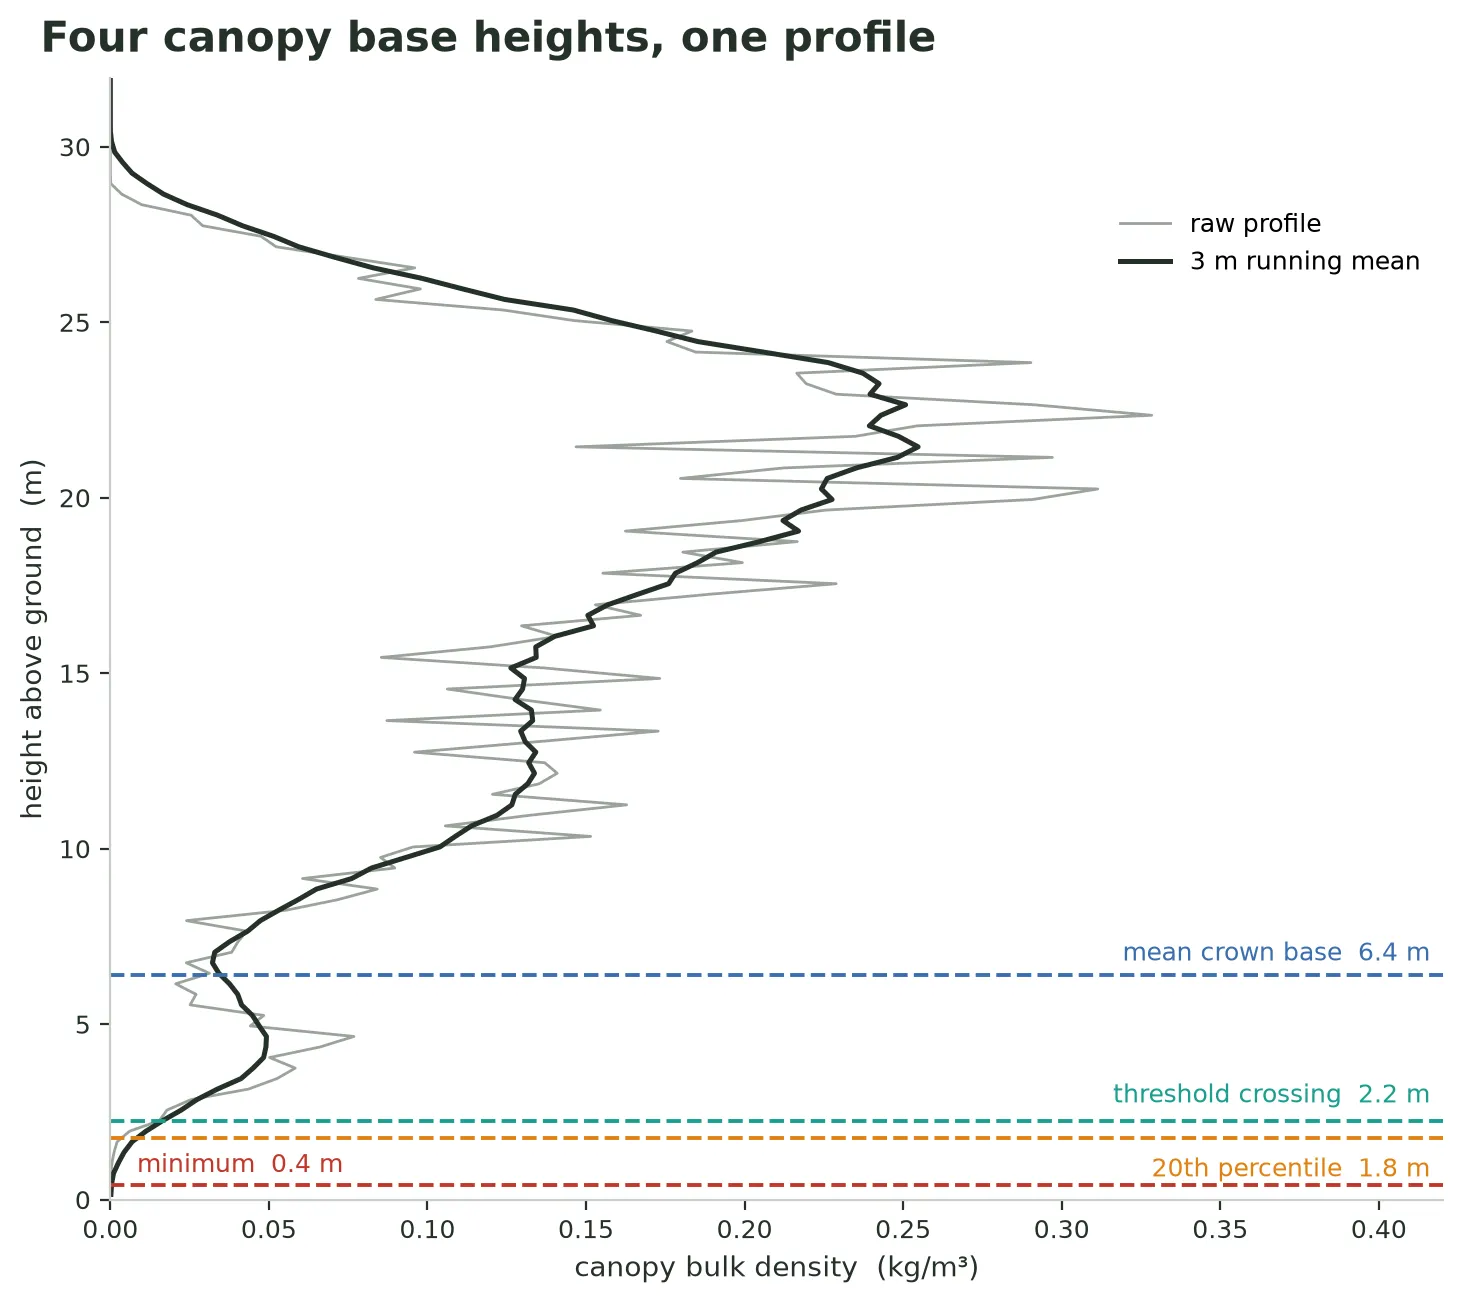
Four canopy base height definitions on one profile from a representative multi-storied stand. The threshold crossing, where the smoothed profile first exceeds 0.012 kg/m³, falls between the 20th-percentile and mean crown bases. The minimum catches the lowest sapling, about four metres below the mean. The stand is illustrative. Every value is computed with the endpoint’s own rules.
Mast et al. (2026) measured how much the choice moves the number. They computed canopy base height across many methods on the same plots. The within-plot range averaged 6 m. Because the initiation relationship is nonlinear, that became a 14 km/h range in predicted torching index. They report that differences on the order of one metre can substantially change predicted crown-fire potential.
Canopy bulk density
Section titled “Canopy bulk density”Canopy bulk density has the same problem one level deeper. Keane (2015) writes that the two main problems with CBD are how to define it and how to estimate it. The endpoint offers two conventions.
The first is load over depth (the load_over_depth method). Divide the
canopy fuel load by a canopy depth. This gives one average density for the whole
crown layer. It is van Wagner’s original construction. His active-crowning
constant of 3.0 was calibrated from a single experimental crown fire in a red
pine plantation, where CBD was computed this way, as load over depth with
uniform fuel (Cruz & Alexander 2010).
Cruz et al. (2003) used the same convention.
They divided by mean crown length and counted foliage only. The depth is itself
a choice. The endpoint offers canopy height minus base height, mean crown
length, or a biomass-percentile span. Each gives a different denominator and a
different density.
The second is the maximum running mean (the maximum_running_mean method,
the default), also called effective CBD. Slide a window up the profile. The
endpoint default window is 3 m. Take the maximum of the running mean. This is
the density of the densest slab of canopy. It is the FuelCalc, FFE-FVS, and
NEXUS lineage.
Scott & Reinhardt (2001) defined
it this way. A whole-crown average is pulled down by the sparse top and bottom
of the profile, and denser layers carry fire better
(Keane 2015, ch. 4).
The running mean reads higher than load over depth. Cruz & Alexander (2010) state that the running-mean definition departs from how van Wagner computed CBD. It gives higher CBD values, and therefore lower critical spread rates for active crowning. They call this a violation of one of the assumptions of van Wagner’s active crown fire model. The higher number is not just different. Paired with van Wagner’s constant of 3.0, which was fit against the lower load-over-depth value, it predicts active crowning more readily. Neither convention is wrong. Each matches a different reference, one the peak of the profile and one the constant in the model that reads it.
Once you read a maximum off a smoothed profile, two more choices change where that maximum falls and where the thresholds cross.
- Window depth. A wider window smooths more and lowers the peak. Published windows differ. FuelCalc 1.7 uses 5 ft. FFE-FVS uses 13 ft. The original FuelCalc method uses 15 ft (Reinhardt et al. 2006). Current NEXUS uses 3 m, the endpoint default. The same effective CBD differs across tools for this reason.
- Edge handling. What the running mean assumes past the ends of the profile
matters only in the lowest and highest layers. Those are where
cbhandchmare read. One convention divides by the full window everywhere and pads with zeros, so a slab reports the same density wherever it sits. Another shortens the window at the ground, which concentrates density near the surface, as FuelCalc does. A third divides by whatever the window covered, which inflates the top layers, as FFE-FVS does, and can reportchmone layer higher on the same profile.
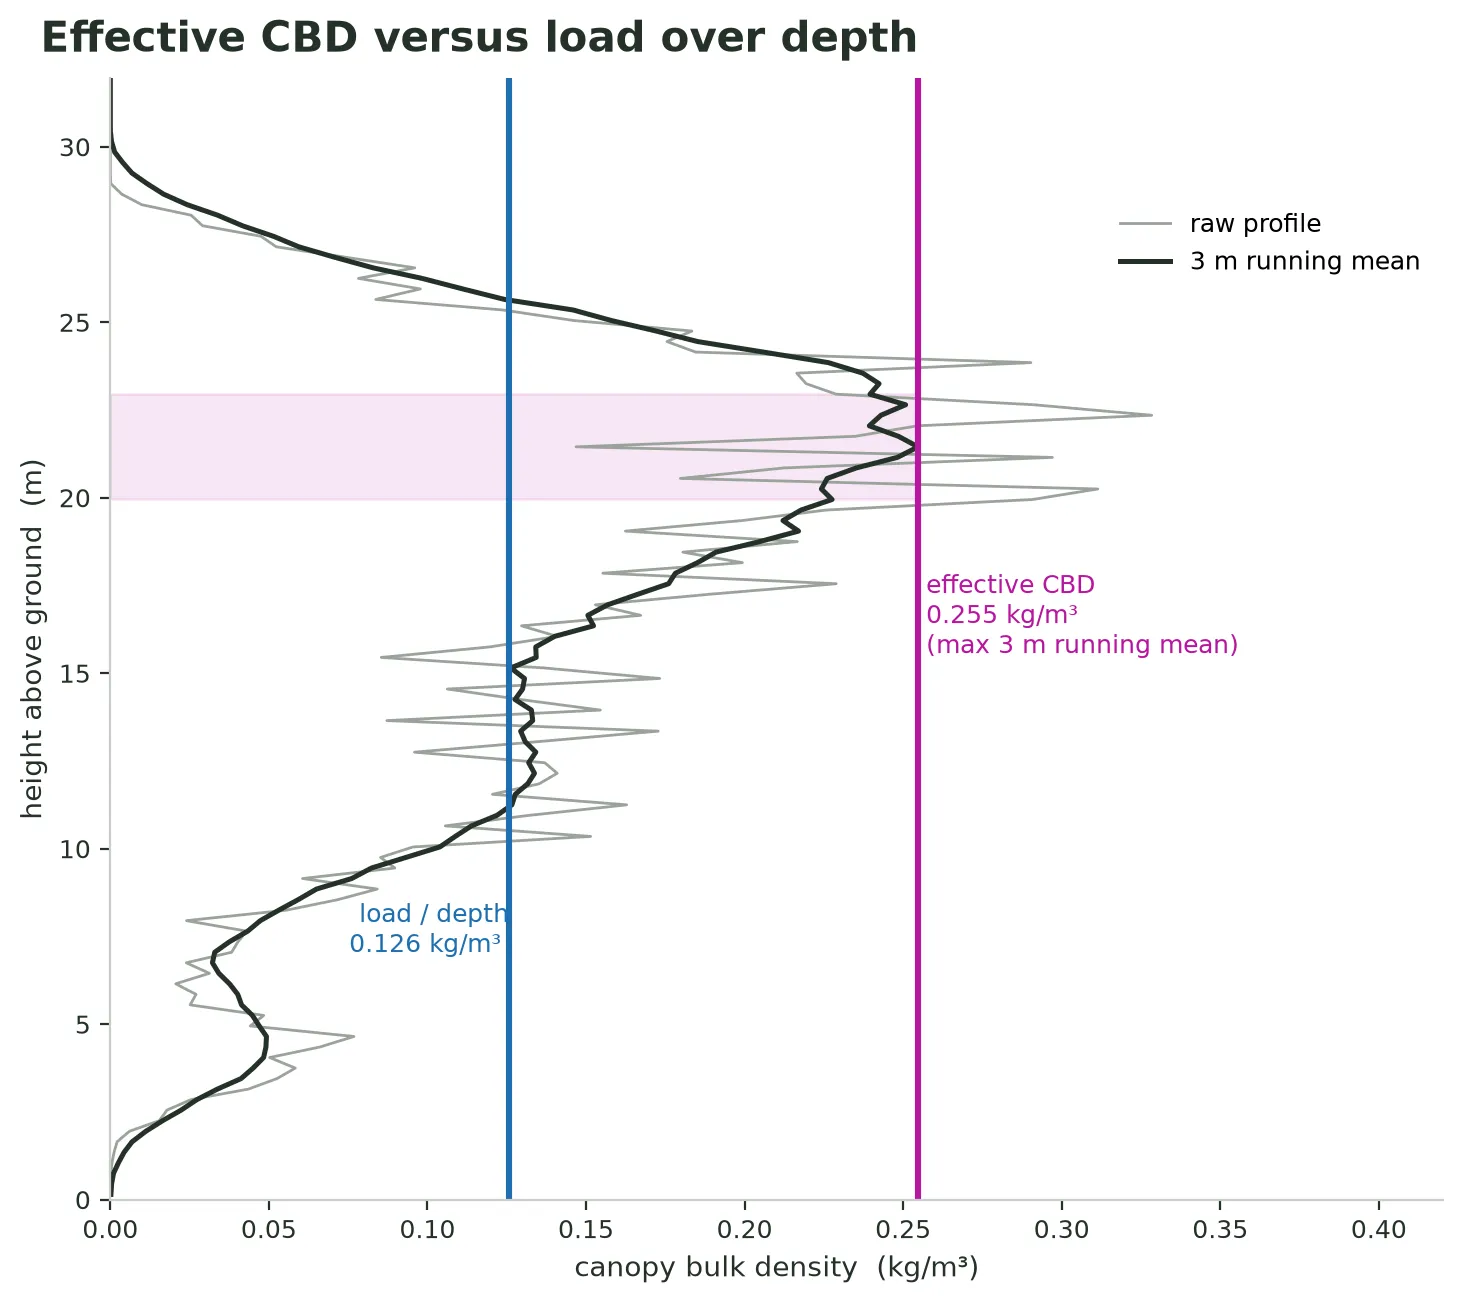
The same profile under two CBD conventions. Effective CBD is the maximum of the 3 m running mean, shown as the shaded band at the densest slab. Load over depth spreads the same fuel over the whole canopy depth and reads about half as much. The raw profile is jagged, which is why the running mean is used. Its bare peaks reach past 0.30 kg/m³, but averaging over 3 m brings the reported maximum down to 0.255.
Canopy height and canopy cover
Section titled “Canopy height and canopy cover”These two variables are also defined by method. The definitions diverge less because the quantity is less ambiguous.
Canopy height (chm) is either the highest threshold crossing of the same
profile that produced cbh, which keeps the two consistent, or a high
percentile of tree heights, with the 99th as the default. Both land near the top
of the canopy. They differ mainly where a few tall trees would raise a plain
maximum but a threshold or percentile would not.
Canopy cover (cc) is the vertically projected cover of the crowns. The
choice is how to treat overlapping crowns. The crown_union method takes the
geometric union of projected crowns from actual stem positions and radii, so it
respects clumping and gaps. The crown_overlap method uses the Crookston-Stage
random-overlap correction, 100 · (1 − exp(−total crown area / cell area)),
which is the cover expected if the same crown area were placed at random. It is
FuelCalc’s estimator, and it ignores where stems actually are. The
cover_fraction method reports the fraction of the cell whose canopy surface
rises above a height threshold, a CHM-style measure rather than a projection of
suspended crown. Keane (2015) notes
that canopy cover carries the same scale and measurement problems as CBD, CH,
and CBH.
How the definition changes the fire prediction
Section titled “How the definition changes the fire prediction”The choices matter because they do not cancel downstream. Feed the same stand’s
readings into van Wagner’s two criteria. The initiation intensity I₀ rises
with CBH. The critical spread rate RAC = 3.0 / CBD falls with CBD. The
definition sets the answer.
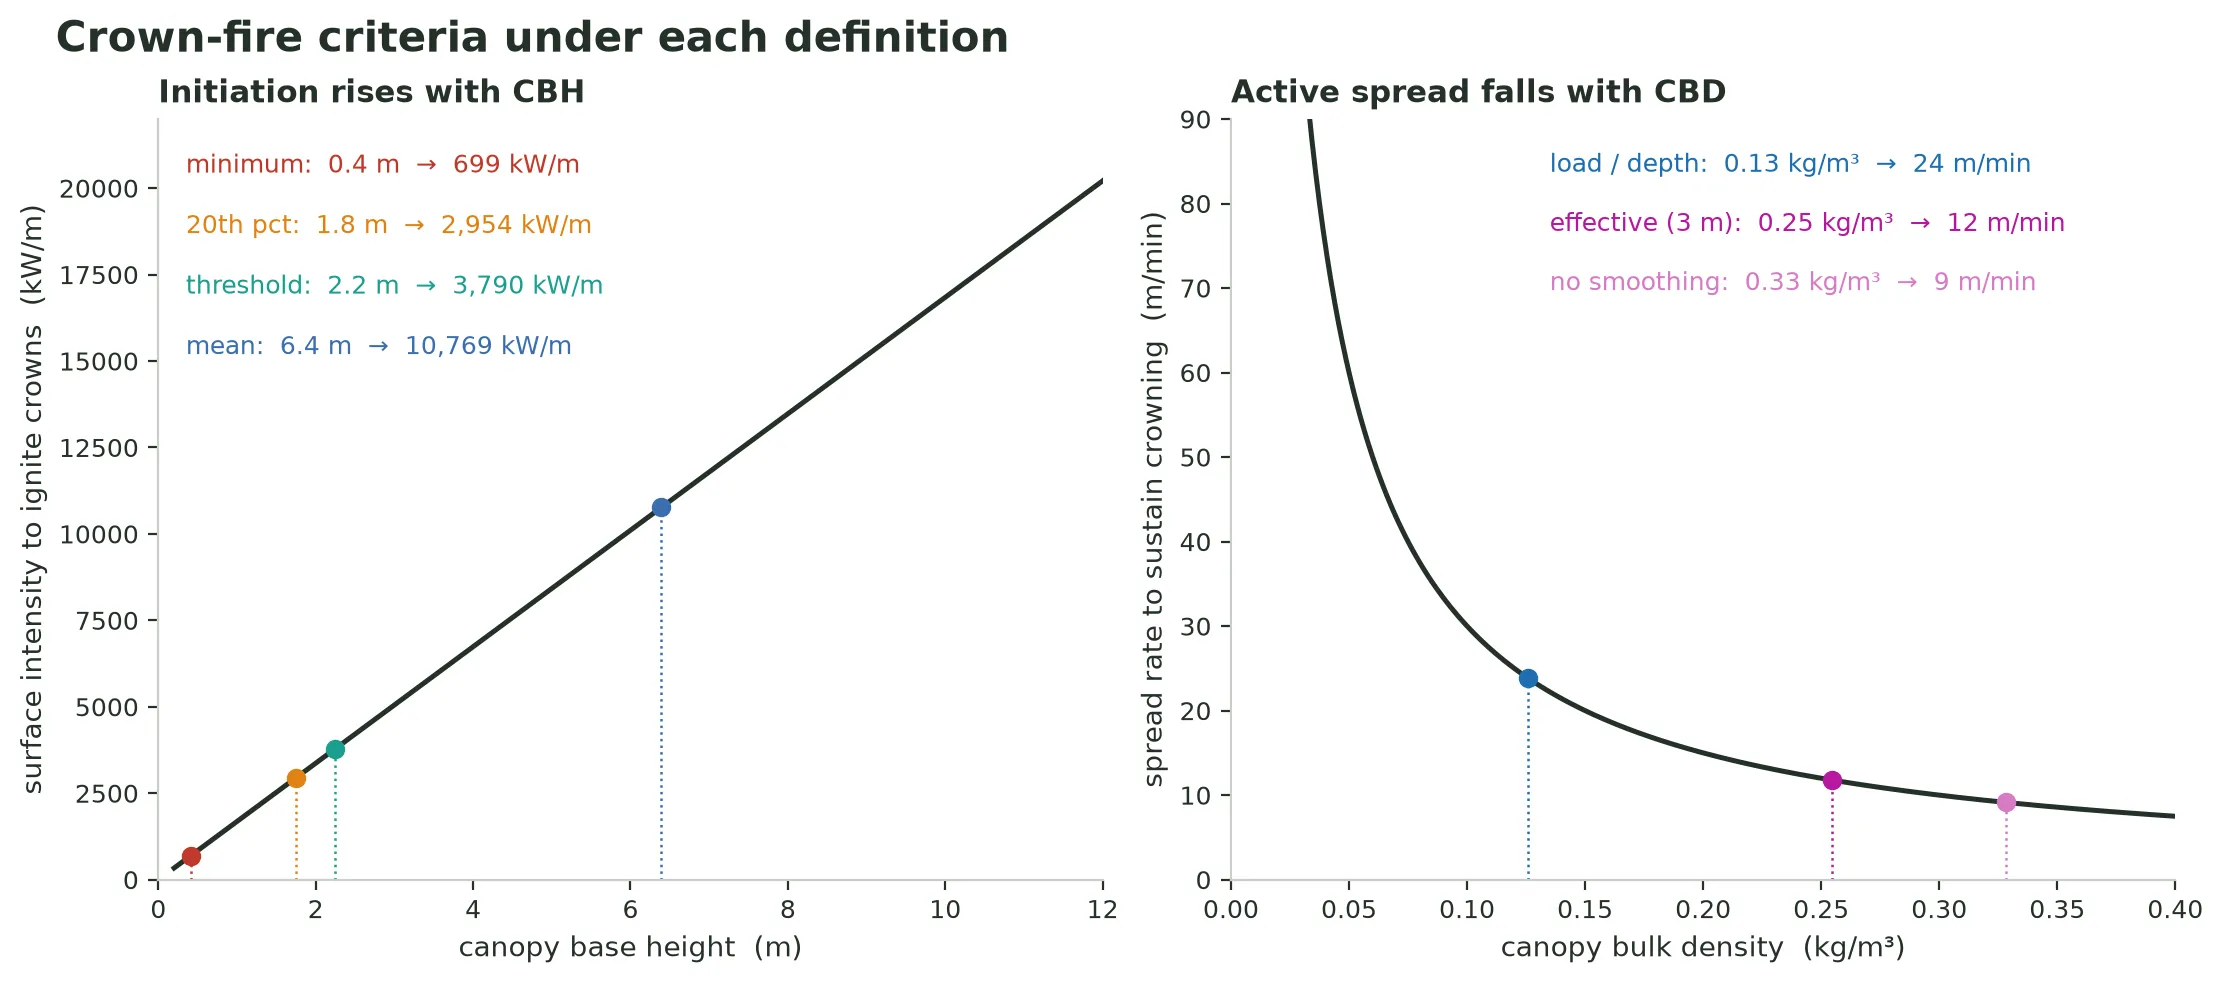
The representative stand’s readings fed to van Wagner’s crown-fire criteria. Across the four canopy base height definitions, the surface intensity needed to reach the crowns spans about fifteenfold, from about 700 to 10,800 kW/m. Across the three canopy bulk density definitions, the spread rate needed to sustain active crowning ranges from 24 down to 9 m per minute. Both relationships are nonlinear, so the definition is amplified downstream rather than averaged out.
A stand screened with a minimum CBH looks far more ignitable than the same stand summarized by its mean. A canopy read with effective CBD sustains crowning at about half the spread rate its load-over-depth value would require. This is the practical effect of a choice that looks definitional.
Reproducing a convention or deviating from it
Section titled “Reproducing a convention or deviating from it”The value means something only next to its definition. The right choice follows from the use.
Reproduce a named convention when the result must match an existing product or feed a model calibrated on it. If you hand the grid to a system that expects FFE-FVS canopy inputs, match FFE-FVS’s threshold, window, and edge handling. This keeps the downstream model’s constants valid, for the same reason that load-over-depth CBD keeps van Wagner’s constant valid. The how-to guide gives request bodies for FuelCalc 1.7, the original FuelCalc method, FFE-FVS, and a LANDFIRE-comparison basis.
Deviate on purpose when the science question calls for a different reading.
Use a lower-tail cbh for conservative, firefighter-safety screening. Use a van
Wagner-consistent load_over_depth CBD with foliage-only fuel when you drive van
Wagner’s own criteria. The endpoint records what you chose.
A canopy value is interpretable only next to the definition that produced it.
The endpoint resolves every omitted choice to an explicit default and writes the
full set onto the grid’s source.
Mast et al. (2026) recommend this,
that practitioners be explicit about the chosen definition and its rationale.
The grid carries its own methods, so the next reader or model can see which
choices produced the number.
Where to go next
Section titled “Where to go next”- Derive canopy fuel from a tree inventory. The recipe, with the fields to set and request bodies for the named conventions and the conservative deviations.
- How grids work. How a grid records the
sourcerecipe that makes these choices reproducible, and how 2D and 3D canopy fuel relate. - How tree detection from a CHM works. Why a CHM-derived inventory resolves the overstory that drives crown-fire spread but not the sub-canopy that drives initiation.