Generate a tree inventory from TreeMap
You are viewing in-progress documentation for v2 (Beta). Switch to the stable version for the current production release.
A tree inventory is a list of individual stems — location, species, DBH, height, crown ratio — and it’s the basis for 3D canopy fuels. FastFuels can generate one for any CONUS domain from the USGS/USFS TreeMap product in two steps:
- Build a PIM grid — a per-cell summary of species composition and stem
density from TreeMap (
pim/treemap). - Realize individual trees — a point process places individual stems
consistent with that grid (
tree/pim).
If you also have a canopy height model (CHM) of the domain, a third,
optional step places those stems only where the CHM shows canopy
(tree/pim/fusion/chm) — see
Condition the trees on a CHM.
Prerequisites
Section titled “Prerequisites”-
An API key: my-api-key.
-
A domain within CONUS: your-domain-id. See Create a domain. TreeMap covers forested lands across the conterminous US.
Step 1 — Build the TreeMap PIM grid
Section titled “Step 1 — Build the TreeMap PIM grid”curl -X 'POST' \ 'https://api-v2-prod-nyvjyh5ywa-uw.a.run.app/domains/your-domain-id/grids/pim/treemap' \ -H 'accept: application/json' \ -H 'api-key: my-api-key' \ -H 'Content-Type: application/json' \ -d '{ "name": "TreeMap PIM grid"}'import fastfuels_sdk.v2 as ff
ff.set_api_key("my-api-key")
domain = ff.Domain.from_id("your-domain-id")
pim = ff.grids.create_pim_grid_from_treemap(domain, name="TreeMap PIM grid")pim.wait()Poll it to completed (TreeMap is coarse — the grid is small and fast), then
record its id: your-pim-grid-id.
{ "id": "your-pim-grid-id", "domain_id": "your-domain-id", "status": "completed", "source": { "name": "pim", "bands": ["tm_id"], "description": "TreeMap plot imputation raster (FIA plot IDs at 30m)", "alignment": { "target": "domain", "method": null, "resolution": null }, "version": "2022", "product": "treemap", "extent_buffer_cells": 0 }, "georeference": { "crs": "EPSG:32611", "shape": [30, 45] }}Step 2 — Realize the tree inventory
Section titled “Step 2 — Realize the tree inventory”Point source_pim_grid_id at the completed PIM grid. seed fixes the
stochastic point process so the inventory is reproducible — same seed, same
trees.
curl -X 'POST' \ 'https://api-v2-prod-nyvjyh5ywa-uw.a.run.app/domains/your-domain-id/inventories/tree/pim' \ -H 'accept: application/json' \ -H 'api-key: my-api-key' \ -H 'Content-Type: application/json' \ -d '{ "name": "TreeMap tree inventory", "source_pim_grid_id": "your-pim-grid-id", "seed": 42}'inventory = ff.inventories.create_tree_inventory_from_pim_grid( domain, pim, seed=42, name="TreeMap tree inventory",){ "id": "your-inventory-id", "domain_id": "your-domain-id", "type": "tree", "name": "TreeMap tree inventory", "description": "", "status": "pending", "progress": null, "created_on": "2026-09-08T15:22:33.179118", "modified_on": "2026-09-08T15:22:33.179118", "checksum": "6273c9f2046145bf9848009dd7a786e5", "source": { "name": "pim", "source_pim_grid_id": "your-pim-grid-id", "source_pim_grid_checksum": "887f565ae7754a0a8361a94705f61db9", "point_process": "inhomogeneous_poisson", "seed": 42 }, "modifications": [], "treatments": [], "columns": [ { "key": "x", "type": "continuous", "unit": "m", "summary": null }, { "key": "y", "type": "continuous", "unit": "m", "summary": null }, { "key": "fia_species_code", "type": "categorical", "unit": null, "summary": null }, { "key": "fia_status_code", "type": "categorical", "unit": null, "summary": null }, { "key": "dbh", "type": "continuous", "unit": "cm", "summary": null }, { "key": "height", "type": "continuous", "unit": "m", "summary": null }, { "key": "crown_ratio", "type": "continuous", "unit": null, "summary": null } ], "forestry_metrics": null, "georeference": null, "error": null, "tags": []}Record the inventory id: your-inventory-id. Poll until completed:
curl -X 'GET' \ 'https://api-v2-prod-nyvjyh5ywa-uw.a.run.app/domains/your-domain-id/inventories/your-inventory-id' \ -H 'accept: application/json' \ -H 'api-key: my-api-key'inventory.wait(){ "id": "your-inventory-id", "domain_id": "your-domain-id", "type": "tree", "name": "TreeMap tree inventory", "description": "", "status": "completed", "progress": { "percent": 100, "message": "Complete" }, "created_on": "2026-09-08T15:22:33.179118Z", "modified_on": "2026-09-08T15:22:37.438106Z", "checksum": "6273c9f2046145bf9848009dd7a786e5", "source": { "point_process": "inhomogeneous_poisson", "name": "pim", "source_pim_grid_id": "your-pim-grid-id", "source_pim_grid_checksum": "887f565ae7754a0a8361a94705f61db9", "seed": 42 }, "modifications": [], "treatments": [], "columns": [ { "key": "x", "type": "continuous", "unit": "m", "summary": { "type": "continuous", "count": 44099, "null_count": 0, "min": 720226.2707794398, "max": 721530.886807579, "mean": 720789.4367628649, "std": 358.88184029148516 } }, { "key": "y", "type": "continuous", "unit": "m", "summary": { "type": "continuous", "count": 44099, "null_count": 0, "min": 5189762.016251005, "max": 5190645.954343839, "mean": 5190180.848408101, "std": 255.37602365689511 } }, { "key": "fia_species_code", "type": "categorical", "unit": null, "summary": { "type": "categorical", "count": 44099, "null_count": 0, "unique_count": 12 } }, { "key": "fia_status_code", "type": "categorical", "unit": null, "summary": { "type": "categorical", "count": 44099, "null_count": 0, "unique_count": 2 } }, { "key": "dbh", "type": "continuous", "unit": "cm", "summary": { "type": "continuous", "count": 44099, "null_count": 0, "min": 2.54, "max": 93.218, "mean": 13.919291004331164, "std": 10.962362475449508 } }, { "key": "height", "type": "continuous", "unit": "m", "summary": { "type": "continuous", "count": 44099, "null_count": 0, "min": 1.8287999999999998, "max": 44.50079999999999, "mean": 8.884457951427468, "std": 5.696343345025 } }, { "key": "crown_ratio", "type": "continuous", "unit": null, "summary": { "type": "continuous", "count": 44099, "null_count": 0, "min": 0.0, "max": 0.95, "mean": 0.4146311707748475, "std": 0.2380315435767045 } } ], "forestry_metrics": { "type": "tree", "tree_count": 44099, "basal_area_per_area": 40.96033605994442, "tree_density": 154.3434721439632, "quadratic_mean_diameter": 6.975477271007933, "dominant_species_groups": [ { "spgrpcd": 4, "name": "Pine", "basal_area_share": 0.7467163889331794 }, { "spgrpcd": 2, "name": "Douglas-fir", "basal_area_share": 0.16918459733516428 }, { "spgrpcd": 6, "name": "Aspen/alder/cottonwood-willow", "basal_area_share": 0.029605373029943687 }, { "spgrpcd": 1, "name": "Cedar/larch", "basal_area_share": 0.022098611473696878 }, { "spgrpcd": 3, "name": "True fir/hemlock", "basal_area_share": 0.01579862379533437 } ] }, "georeference": { "crs": "EPSG:32611", "bounds": [720226.0, 5189762.0, 721534.0, 5190646.0] }, "error": null, "tags": []}The completed inventory’s columns describe each tree: x, y,
fia_species_code, fia_status_code, dbh (cm), height (m), and
crown_ratio. On the Blue Mountain domain this seed produces ≈44,000 stems.
Step 3 — Condition the trees on a CHM (optional)
Section titled “Step 3 — Condition the trees on a CHM (optional)”TreeMap assigns a plot to every 30 m cell it can match to an FIA plot and
leaves the cells it cannot match empty. Neither decision looks at the canopy
on the ground: a matched cell receives its plot’s trees whether or not the cell
is forested, and an unmatched cell receives none even where it is. If you have
a canopy height model of the domain, tree/pim/fusion/chm expands the same PIM
grid but decides cell by cell, from the CHM, whether trees belong there:
- Where the CHM shows canopy over a cell TreeMap left empty, the nearest plot is imputed and its trees are placed. This fills TreeMap’s gaps.
- Where the CHM shows no canopy over a cell TreeMap matched, the plot is dropped and no trees are placed. This removes trees from open ground.
The trees keep TreeMap’s full attribute set — species, DBH, height, crown ratio — and are placed only where the CHM shows canopy.
Build or pick a CHM grid
Section titled “Build or pick a CHM grid”Any completed grid in this domain with a chm band in meters will do. The
examples below use the NAIP canopy height model, the same grid
Generate a tree inventory from a CHM
builds in its first step; a CHM
built from a point cloud
or uploaded as a GeoTIFF
works the same way. Poll it to completed and record its id:
your-chm-grid-id.
See Build the CHM grid.
chm = ff.grids.create_canopy_height_grid_from_naip_chm(domain, name="NAIP CHM grid")chm.wait()Create the conditioned inventory
Section titled “Create the conditioned inventory”Point source_pim_grid_id at the PIM grid from Step 1 and source_chm_grid_id
at the CHM grid. method names the fusion algorithm and its parameters; the
values below are the defaults, so you can omit method entirely to get the
same result. seed works as in Step 2.
curl -X 'POST' \ 'https://api-v2-prod-nyvjyh5ywa-uw.a.run.app/domains/your-domain-id/inventories/tree/pim/fusion/chm' \ -H 'accept: application/json' \ -H 'api-key: my-api-key' \ -H 'Content-Type: application/json' \ -d '{ "name": "TreeMap tree inventory conditioned on CHM", "source_pim_grid_id": "your-pim-grid-id", "source_chm_grid_id": "your-chm-grid-id", "seed": 42, "method": { "name": "reimputation", "resolution": 7.5, "min_height": 2.0, "cover_threshold": 0.2 }}'inventory = ff.inventories.create_tree_inventory_from_pim_chm_fusion( domain, pim, chm, seed=42, method={"resolution": 7.5, "min_height": 2.0, "cover_threshold": 0.2}, name="TreeMap tree inventory conditioned on CHM",){ "id": "your-inventory-id", "domain_id": "your-domain-id", "type": "tree", "name": "TreeMap tree inventory conditioned on CHM", "description": "", "status": "pending", "progress": null, "created_on": "2026-09-08T15:22:33.558252", "modified_on": "2026-09-08T15:22:33.558252", "checksum": "f342cdb5bd134174be919556f47cac86", "source": { "name": "pim", "fusion": ["chm"], "source_pim_grid_id": "your-pim-grid-id", "source_pim_grid_checksum": "887f565ae7754a0a8361a94705f61db9", "source_chm_grid_id": "your-chm-grid-id", "source_chm_grid_checksum": "fcb2e6e7437b451b8d76cc3b9bb1c4aa", "method": { "name": "reimputation", "resolution": 7.5, "min_height": 2.0, "cover_threshold": 0.2 }, "point_process": "inhomogeneous_poisson", "seed": 42 }, "modifications": [], "treatments": [], "columns": [ { "key": "x", "type": "continuous", "unit": "m", "summary": null }, { "key": "y", "type": "continuous", "unit": "m", "summary": null }, { "key": "fia_species_code", "type": "categorical", "unit": null, "summary": null }, { "key": "fia_status_code", "type": "categorical", "unit": null, "summary": null }, { "key": "dbh", "type": "continuous", "unit": "cm", "summary": null }, { "key": "height", "type": "continuous", "unit": "m", "summary": null }, { "key": "crown_ratio", "type": "continuous", "unit": null, "summary": null } ], "forestry_metrics": null, "georeference": null, "error": null, "tags": []}The response’s source records both grids and their checksums, fusion: ["chm"], and the method that was applied. Record the inventory id:
your-inventory-id, and poll it to completed exactly as in Step 2:
{ "id": "your-inventory-id", "domain_id": "your-domain-id", "type": "tree", "name": "TreeMap tree inventory conditioned on CHM", "description": "", "status": "completed", "progress": { "percent": 100, "message": "Complete" }, "created_on": "2026-09-08T15:22:33.558252Z", "modified_on": "2026-09-08T15:22:42.331321Z", "checksum": "f342cdb5bd134174be919556f47cac86", "source": { "fusion": ["chm"], "method": { "min_height": 2.0, "name": "reimputation", "resolution": 7.5, "cover_threshold": 0.2 }, "seed": 42, "name": "pim", "source_chm_grid_checksum": "fcb2e6e7437b451b8d76cc3b9bb1c4aa", "source_pim_grid_id": "your-pim-grid-id", "source_chm_grid_id": "your-chm-grid-id", "point_process": "inhomogeneous_poisson", "source_pim_grid_checksum": "887f565ae7754a0a8361a94705f61db9" }, "modifications": [], "treatments": [], "columns": [ { "key": "x", "type": "continuous", "unit": "m", "summary": { "type": "continuous", "count": 53282, "null_count": 0, "min": 720226.0003150188, "max": 721530.8123194346, "mean": 720811.6062926742, "std": 351.7727544731188 } }, { "key": "y", "type": "continuous", "unit": "m", "summary": { "type": "continuous", "count": 53282, "null_count": 0, "min": 5189762.002975728, "max": 5190645.978815561, "mean": 5190211.076738614, "std": 260.54825423663846 } }, { "key": "fia_species_code", "type": "categorical", "unit": null, "summary": { "type": "categorical", "count": 53282, "null_count": 0, "unique_count": 12 } }, { "key": "fia_status_code", "type": "categorical", "unit": null, "summary": { "type": "categorical", "count": 53282, "null_count": 0, "unique_count": 2 } }, { "key": "dbh", "type": "continuous", "unit": "cm", "summary": { "type": "continuous", "count": 53282, "null_count": 0, "min": 2.54, "max": 93.218, "mean": 13.835692053601592, "std": 10.644656399565706 } }, { "key": "height", "type": "continuous", "unit": "m", "summary": { "type": "continuous", "count": 53282, "null_count": 0, "min": 1.8287999999999998, "max": 44.50079999999999, "mean": 8.735635959611125, "std": 5.466895967382896 } }, { "key": "crown_ratio", "type": "continuous", "unit": null, "summary": { "type": "continuous", "count": 53282, "null_count": 0, "min": 0.0, "max": 0.95, "mean": 0.39849893022033706, "std": 0.24383459451164752 } } ], "forestry_metrics": { "type": "tree", "tree_count": 53282, "basal_area_per_area": 48.04181715446447, "tree_density": 186.48334163528986, "quadratic_mean_diameter": 6.872678003448064, "dominant_species_groups": [ { "spgrpcd": 4, "name": "Pine", "basal_area_share": 0.7646448602486037 }, { "spgrpcd": 2, "name": "Douglas-fir", "basal_area_share": 0.15155054891271058 }, { "spgrpcd": 6, "name": "Aspen/alder/cottonwood-willow", "basal_area_share": 0.029818598290393978 }, { "spgrpcd": 1, "name": "Cedar/larch", "basal_area_share": 0.018902794754553313 }, { "spgrpcd": 3, "name": "True fir/hemlock", "basal_area_share": 0.016015520858422342 } ] }, "georeference": { "crs": "EPSG:32611", "bounds": [720226.0, 5189762.0, 721534.0, 5190646.0] }, "error": null, "tags": []}The columns are the same seven as a tree/pim inventory. On the Blue Mountain
domain this seed produces ≈53,300 stems against ≈44,000 from Step 2 — more,
not fewer, because TreeMap has no plot for roughly half of this domain’s cells
and the CHM shows canopy over much of that area.
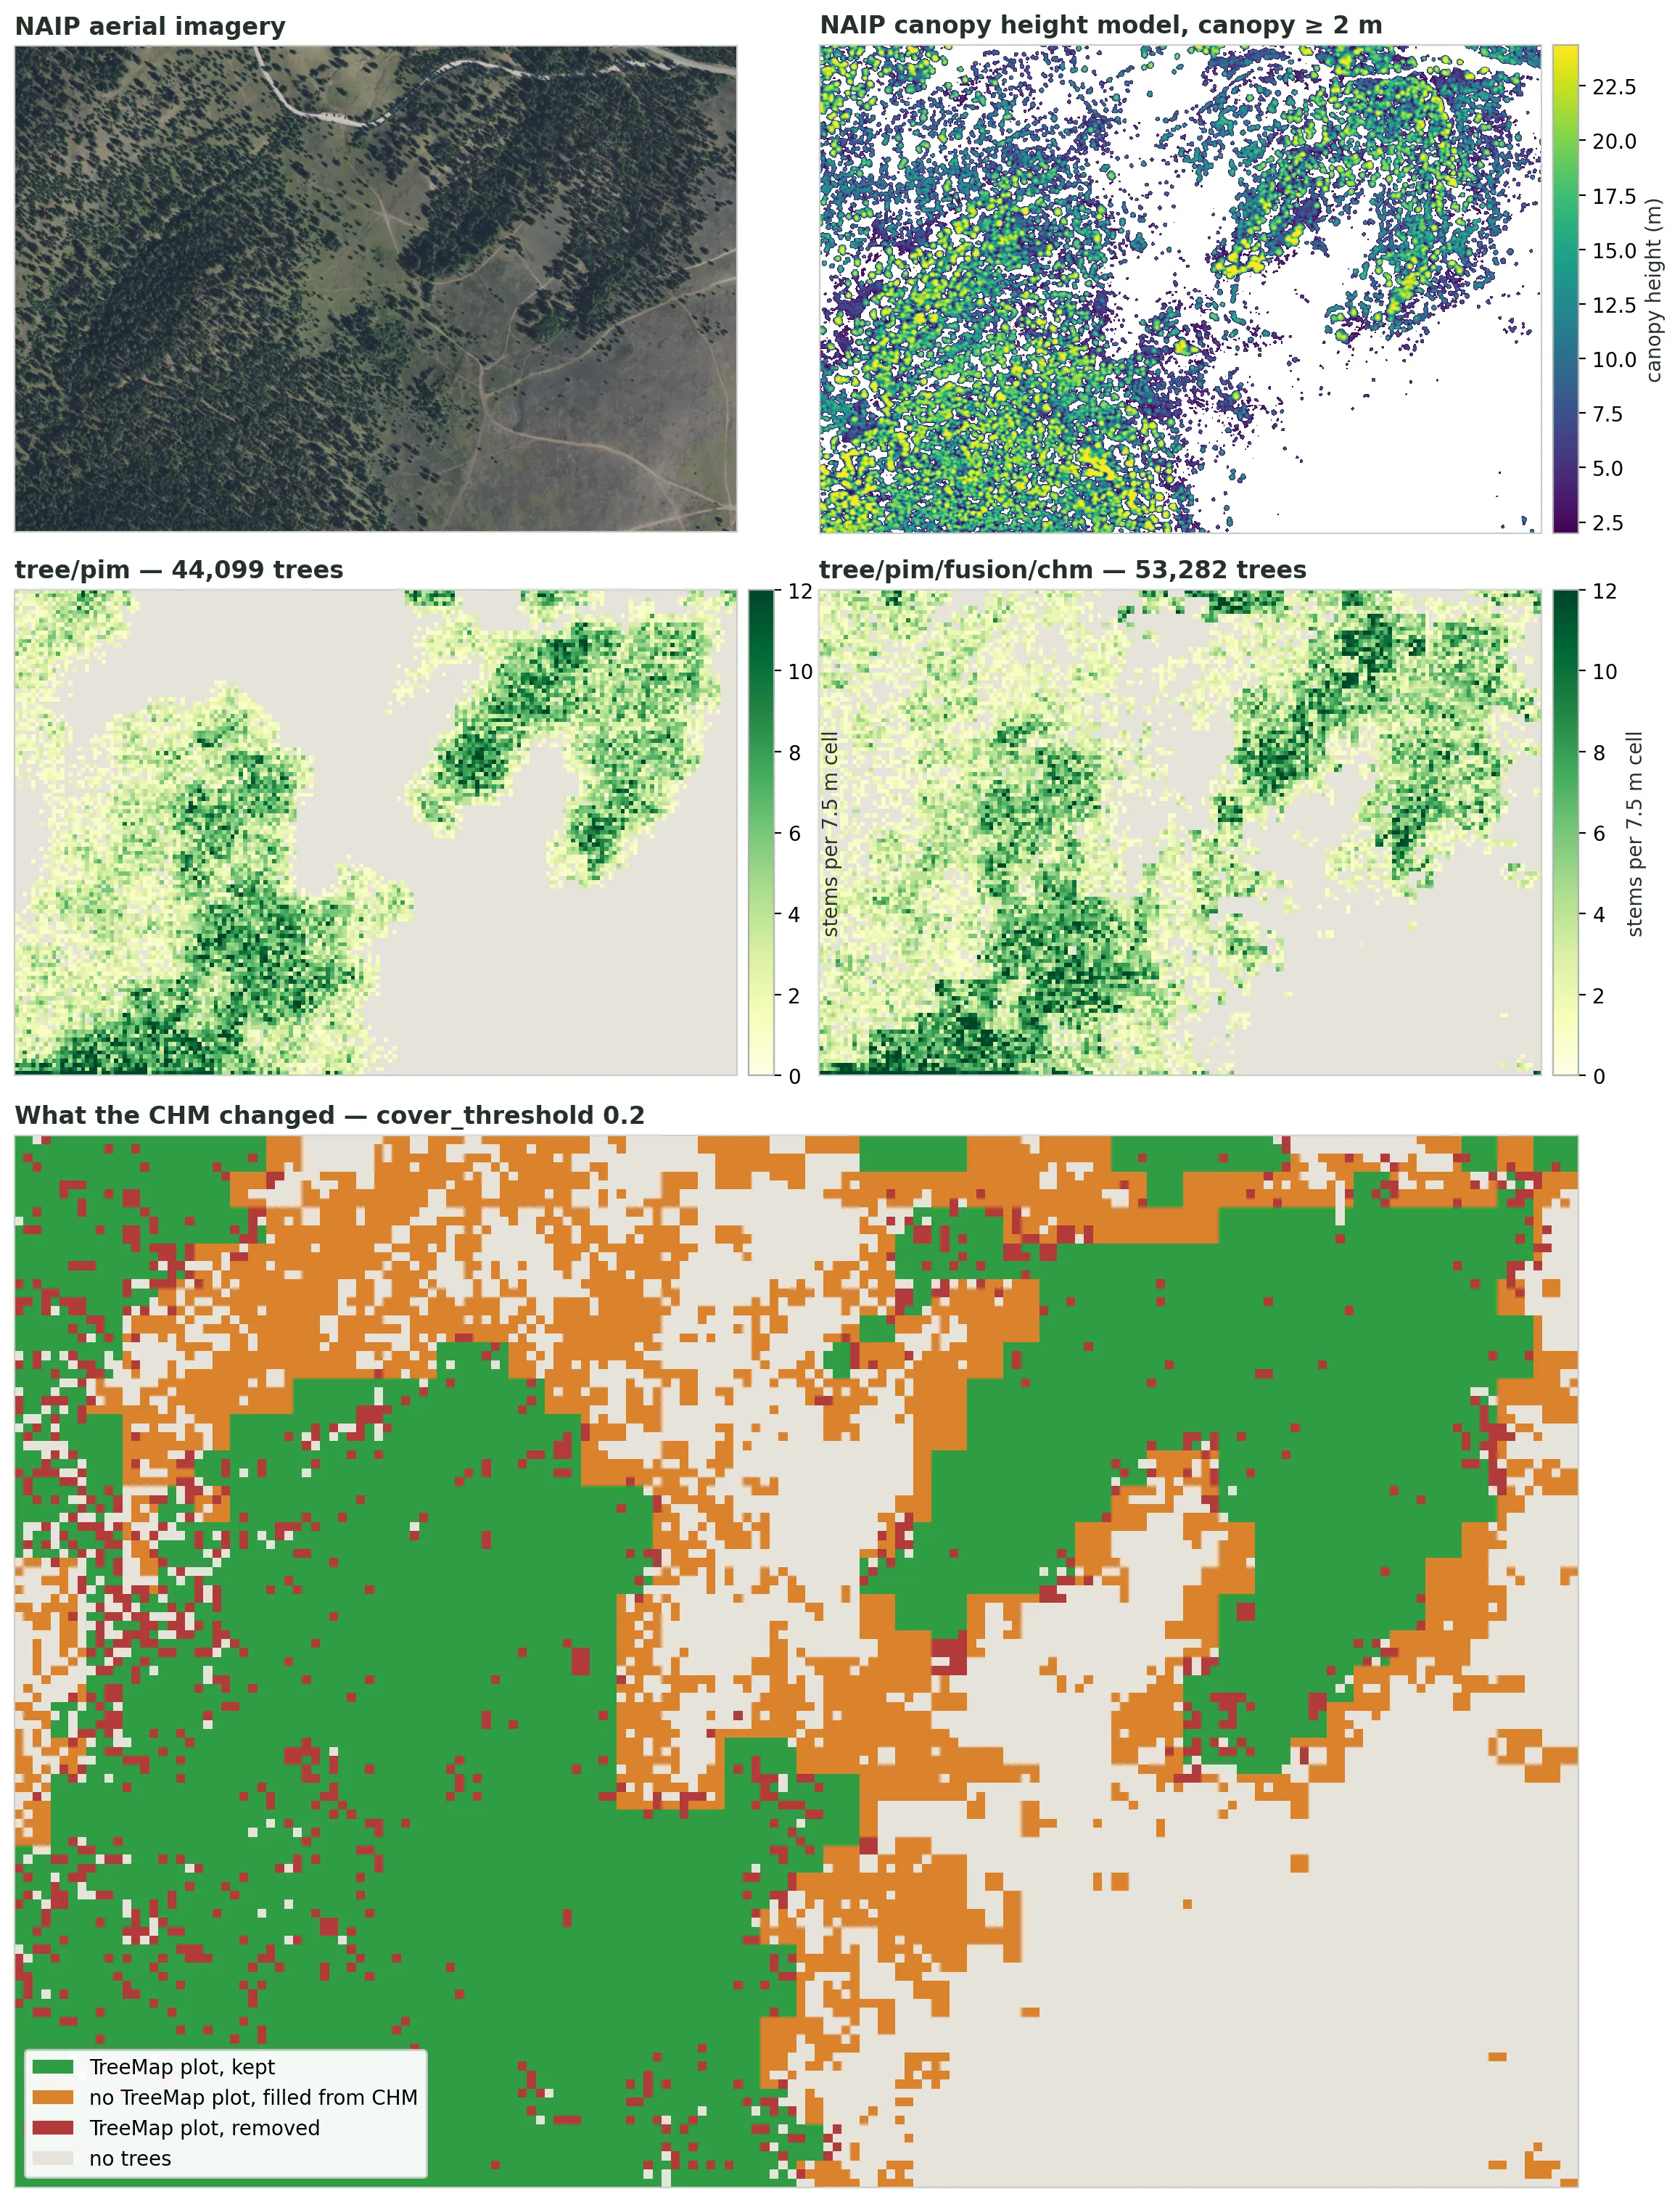
Top: NAIP aerial imagery of the domain (USGS National Map) and the
NAIP CHM
built from it, with canopy below min_height (2 m) left blank. Middle:
the tree/pim inventory from Step 2 and the same PIM grid conditioned on
the CHM, both as stems per 7.5 m cell; grey is a cell with no trees.
Bottom: how each 7.5 m cell changed relative to tree/pim — kept, filled
from the CHM over a TreeMap gap, or removed where the CHM shows no canopy.
Choose cover_threshold
Section titled “Choose cover_threshold”method has three fields. The decision is made per cell at resolution, and
a cell counts as canopy-covered when at least cover_threshold of the CHM
cells inside it are taller than min_height:
| Field | Default | What it does |
|---|---|---|
resolution | 7.5 m | Cell size at which the keep-or-drop decision is made. Must be no finer than the CHM’s cell and no coarser than the PIM’s (0.6 m and 30 m for NAIP and TreeMap). |
min_height | 2.0 m | CHM height a cell must reach to count as canopy. Raise it to ignore shrubs and regeneration. |
cover_threshold | 0.2 | Fraction of a resolution cell that must be canopy for the cell to receive trees. Cells at or below it get none. |
cover_threshold sets the balance between the two effects. A low value fills
almost every TreeMap gap the CHM shows any canopy over and removes plots only
from cells that are nearly bare; a high value fills only well-covered gaps and
removes plots from every cell with broken canopy. On the Blue Mountain domain,
same seed:
cover_threshold | Trees |
|---|---|
| 0.05 | 56,645 |
| 0.2 (default) | 53,282 |
| 0.5 | 44,995 |
| 0.75 | 37,068 |
tree/pim, no CHM | 44,099 |
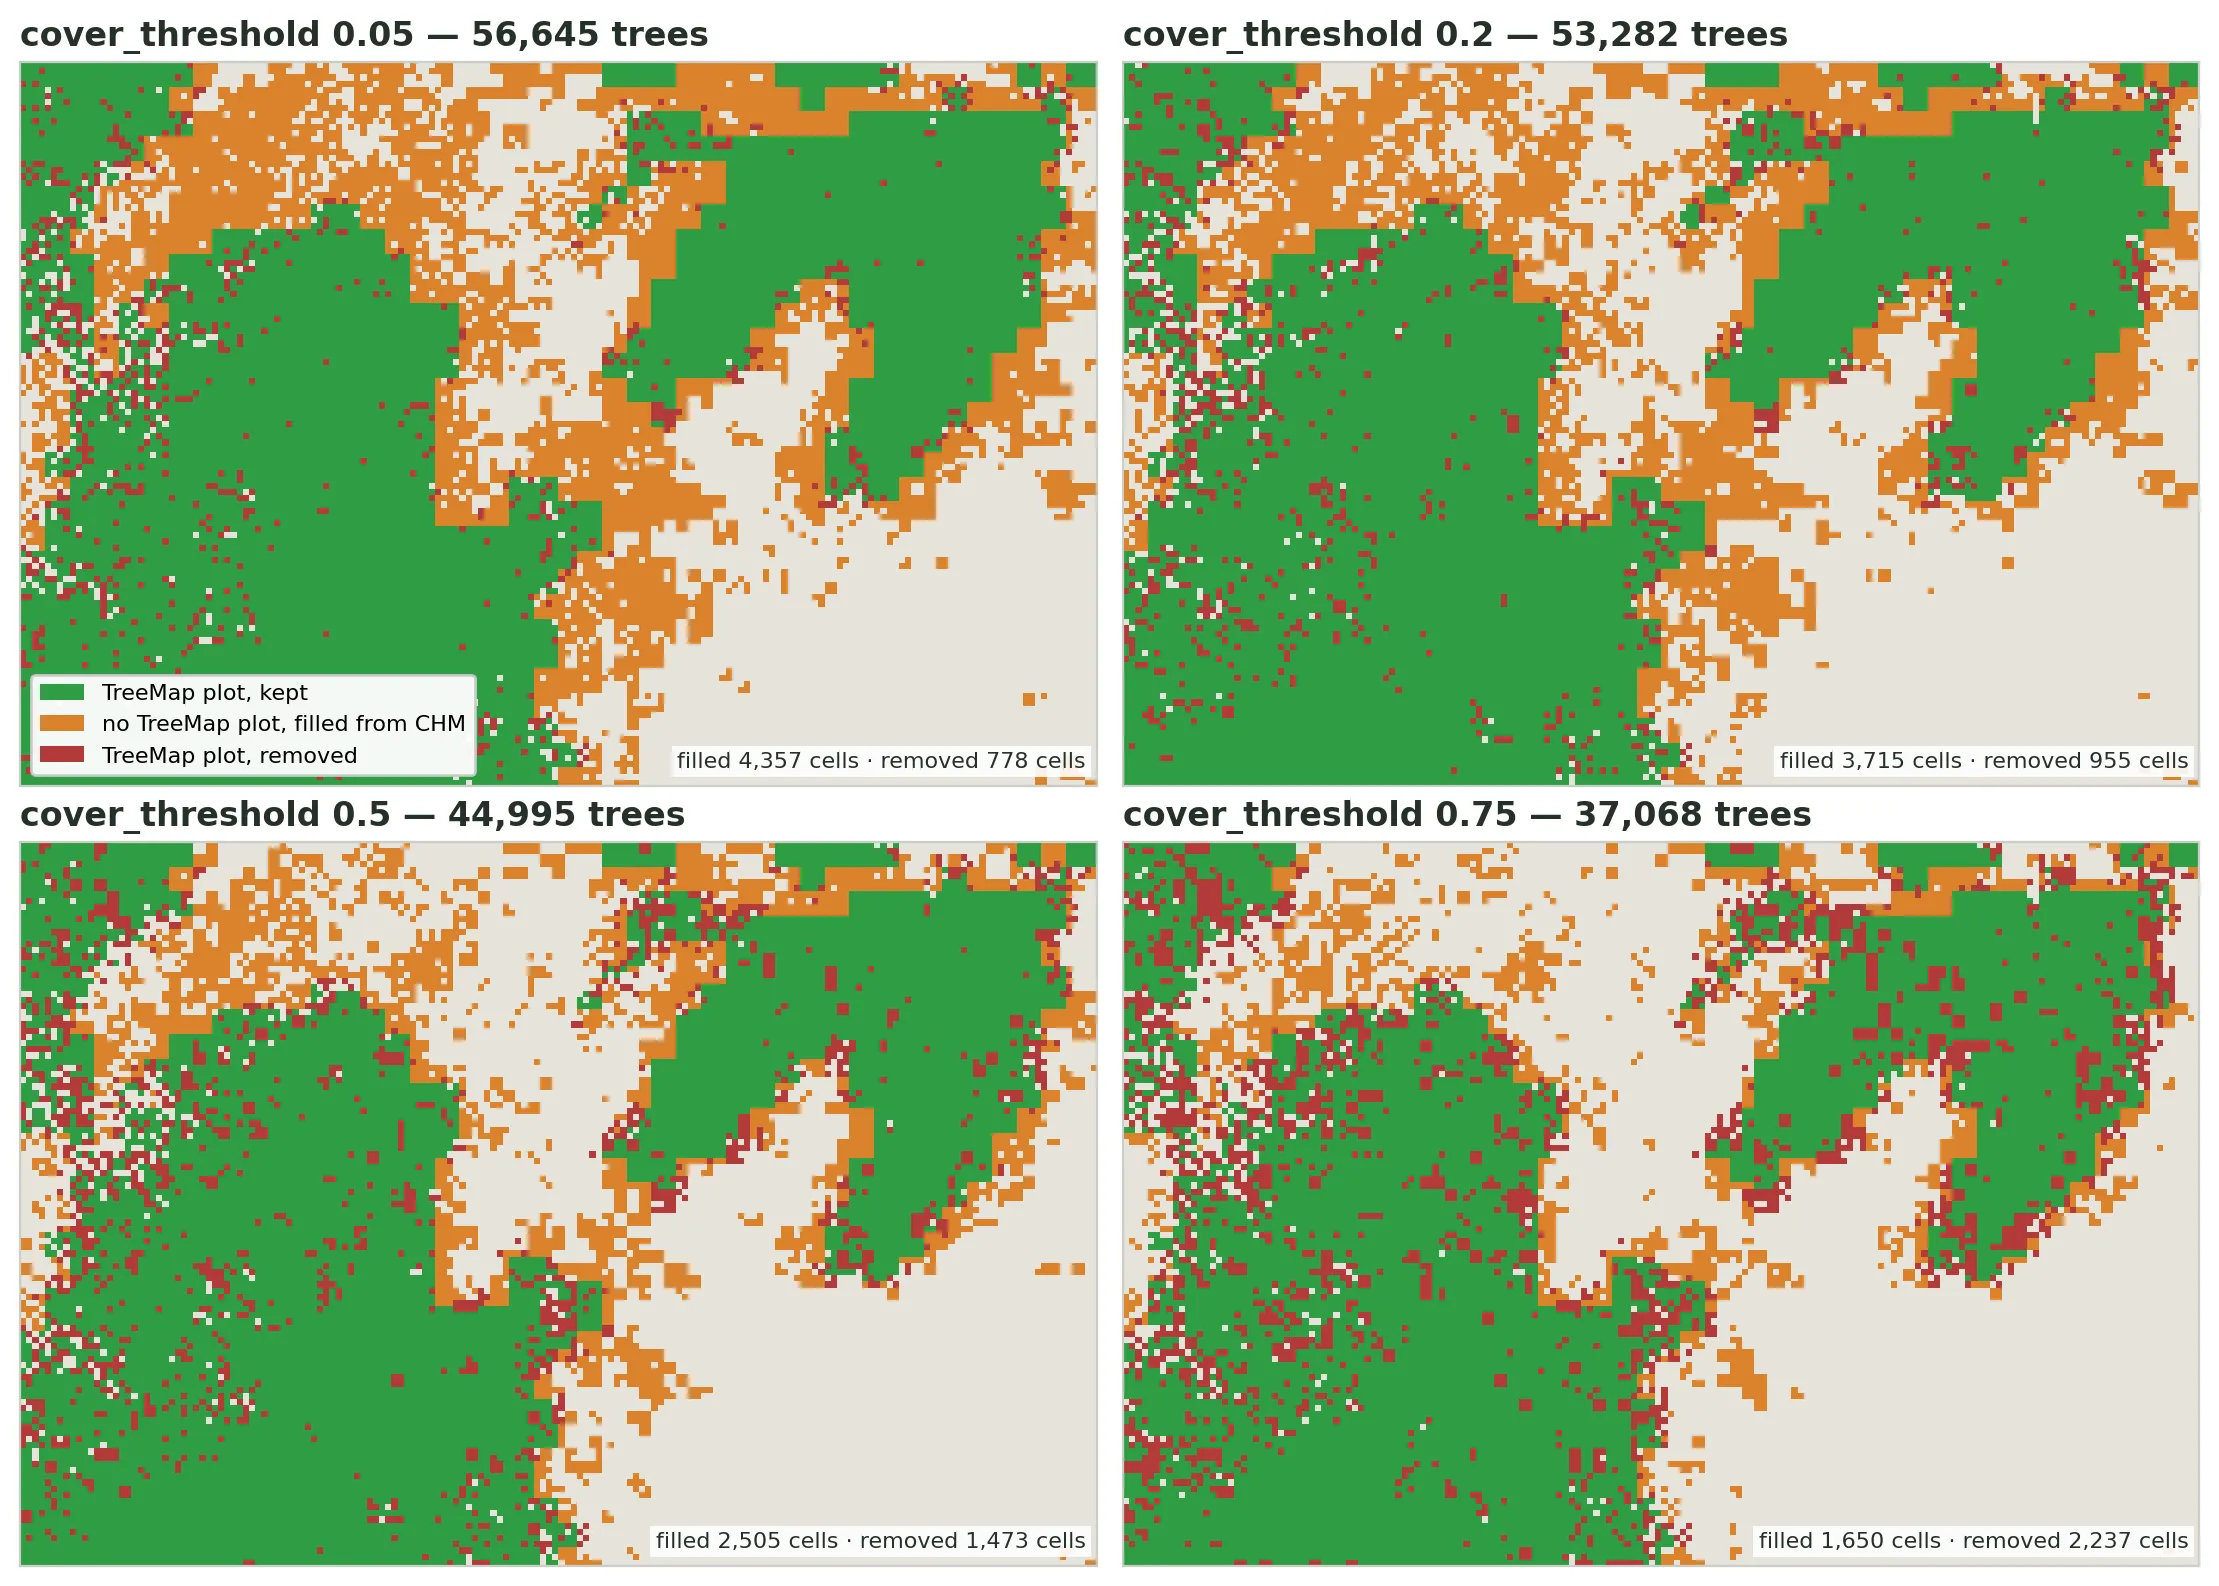
Each 7.5 m cell’s change relative to tree/pim at four values of
cover_threshold. As the threshold rises, fewer TreeMap gaps are filled
(orange) and more TreeMap plots are removed (red), starting at the edges
of the forest patches and in cells with scattered cover.
Raise the threshold when TreeMap places trees on ground you know is open — recent clearings, burns, meadows the CHM resolves — and lower it when the domain has many TreeMap gaps over real forest. There is no correct value; check the result against the CHM by exporting both and overlaying them, as you would for a detected inventory.
Next steps
Section titled “Next steps”- Trim it — remove trees near roads or water.
- Inspect the stems — fetch and stream the inventory data.
Other ways to get a tree inventory: from a canopy height model (from a CHM) or by uploading your own tree list.
Common pitfalls
Section titled “Common pitfalls”- Domain outside CONUS. TreeMap is a conterminous-US product.
- Creating the inventory before the PIM grid is
completed.tree/pimreads the PIM grid’s data — poll step 1 tocompletedfirst. - Expecting identical trees without a seed. Omit
seedand each run draws a fresh random realization. Set it when you need reproducibility. - Expecting a conditioned inventory to have fewer trees. Fusion fills
TreeMap’s gaps as well as pruning its plots, so on a domain where TreeMap
left cells unmatched it can produce more trees than
tree/pim. Compare the two inventories on the map, not by count; raisecover_thresholdif you want pruning to dominate. - A
resolutionoutside the grids’ cell sizes.tree/pim/fusion/chmreturns422ifmethod.resolutionis finer than the CHM’s cell or coarser than the PIM’s. The default 7.5 m sits between every CHM source and TreeMap’s 30 m. - A CHM grid that isn’t a 2D height surface in meters. The CHM grid must
carry a
chmband with unitm; a grid in feet, or a 3D grid, is rejected with422. Uploaded GeoTIFFs are the usual cause — set the band unit when you upload. - No canopy above the threshold anywhere. If no cell clears
cover_threshold, the inventory fails withEMPTY_AFTER_FUSIONand the error message reports the highest cover observed. Lowercover_thresholdormin_height, or check that the CHM actually covers vegetated ground.