Create solar irradiance grids
You are viewing in-progress documentation for v2 (Beta). Switch to the stable version for the current production release.
LeafLux turns a 3D canopy fuel grid into relative solar irradiance: how much
of the available sunlight reaches each point, after the canopy above it has
absorbed the rest. One endpoint, grids/solar/irradiance/leaflux, produces two
outputs, and the bands list picks which you get:
| Band | Where | Output |
|---|---|---|
irradiance.surface.relative | on the ground beneath the canopy | 2D (y, x) |
irradiance.canopy.relative | inside the canopy, per voxel | 3D (z, y, x) |
Both are relative values in [0, 1] — a fraction of open-sky irradiance,
not an energy flux. The 2D-versus-3D choice is entirely the bands list: ask
for the surface band and you get a flat raster; ask for the canopy band and you
get a per-voxel volume; ask for both and you get one 3D grid carrying each. This
guide builds each in turn, then tunes the result with the two inputs that shape
every LeafLux grid — the date_time that fixes the sun’s position and the
extinction_coefficient that sets how fast light is absorbed through foliage.
Prerequisites
Section titled “Prerequisites”-
An API key. my-api-key.
-
A domain. your-domain-id.
-
A completed 3D canopy grid with a
leaf_area_densityband. your-leaf-area-density-grid-id. This is the source LeafLux attenuates light through. Voxelize a tree inventory requesting"bands": ["leaf_area_density"]to build one. -
(Optional) a 2D terrain grid for surface draping. your-topography-grid-id. Omit it and the surface is a flat plane; supply it and slope and aspect shade the result too. Build one from 3DEP, aligned to the source grid’s lattice (see the caution below).
The source grid behind the responses and figures on this page is a
NAIP canopy height model
turned into overstory tree detections, completed with
GDAM allometry,
then voxelized to leaf area density —
a reproducible lineage over the Blue Mountain domain. Any completed 3D grid with
a leaf_area_density band drives LeafLux the same way.
The whole flow — create, poll, and read the band back — in one script:
"""Create a 3D canopy irradiance grid, poll it, and read the band back.
Point source_grid at a completed 3D grid that carries a leaf_area_densityband (a voxelized canopy inventory)."""
from datetime import datetime, timezone
import numpy as np
import fastfuels_sdk.v2 as ff
ff.set_api_key("my-api-key")
# 1. Create the grid and wait for it to finish. Pass the source grid id plus#    its domain (or a Grid object, which carries its own domain).grid = ff.grids.create_irradiance_grid_from_leaflux(    "your-leaf-area-density-grid-id",    domain="your-domain-id",    date_time=datetime(2025, 7, 1, 19, 0, tzinfo=timezone.utc),    bands=["irradiance.canopy.relative"],    name="Canopy irradiance",)grid.wait()  # polls until completed or failed
# 2. Read the 3D band into one (z, y, x) array. to_numpy reassembles the#    sparse chunks for you — no manual COO decoding, offsets, or dtype headers.volume = grid.to_numpy("irradiance.canopy.relative")
# 3. Values are relative irradiance in [0, 1]; NaN outside the canopy.canopy = volume[np.isfinite(volume)]
Create a 2D surface irradiance grid
Section titled “Create a 2D surface irradiance grid”Ask for only irradiance.surface.relative and LeafLux returns a 2D raster:
relative irradiance on the ground, after the canopy has intercepted its share.
With no terrain grid, the surface is a flat plane, so the only shadows are the
ones the canopy casts.
curl -X 'POST' \ 'https://api-v2-prod-nyvjyh5ywa-uw.a.run.app/domains/your-domain-id/grids/solar/irradiance/leaflux' \ -H 'accept: application/json' \ -H 'api-key: my-api-key' \ -H 'Content-Type: application/json' \ -d '{ "source_lad_grid_id": "your-leaf-area-density-grid-id", "bands": ["irradiance.surface.relative"], "date_time": "2025-07-01T19:00:00Z", "name": "Surface irradiance (flat)"}'from datetime import datetime, timezone
import fastfuels_sdk.v2 as ff
ff.set_api_key("my-api-key")
# No terrain grid: surface irradiance is evaluated on a flat plane, so the# only shadows are the ones the canopy casts.grid = ff.grids.create_irradiance_grid_from_leaflux( "your-leaf-area-density-grid-id", domain="your-domain-id", date_time=datetime(2025, 7, 1, 19, 0, tzinfo=timezone.utc), bands=["irradiance.surface.relative"], name="Surface irradiance (flat)",){ "id": "your-irradiance-grid-id", "domain_id": "your-domain-id", "name": "Surface irradiance (flat)", "description": "", "status": "pending", "progress": null, "created_on": "{{CREATED_ON}}", "modified_on": "{{MODIFIED_ON}}", "checksum": "fc2012e3142a4c7098c9cda1caa53bc3", "source": { "operation": "irradiance", "input": "grid", "entity": "solar", "source_lad_grid_id": "your-leaf-area-density-grid-id", "source_grid_checksum": "a6ce61726c234aa38d4dac80345a8dad", "bands": ["irradiance.surface.relative"], "date_time": "2025-07-01T19:00:00Z", "extinction_coefficient": 0.5 }, "modifications": [], "bands": [ { "key": "irradiance.surface.relative", "name": "Relative Irradiance on Surface", "description": "Relative irradiance on the terrain surface [0-1] beneath the canopy.", "type": "continuous", "unit": null, "index": 0, "nodata": null, "summary": null } ], "georeference": null, "error": null, "chunks": null, "tags": []}Record the id as your-irradiance-grid-id and poll it to completed.
Because no canopy band was requested, the grid is genuinely two-dimensional —
georeference.shape is (y, x) with no vertical axis, and it exports and reads
back as a plain raster.
curl -X 'GET' \ 'https://api-v2-prod-nyvjyh5ywa-uw.a.run.app/domains/your-domain-id/grids/your-irradiance-grid-id' \ -H 'accept: application/json' \ -H 'api-key: my-api-key'{ "id": "your-irradiance-grid-id", "domain_id": "your-domain-id", "name": "Surface irradiance (flat)", "description": "", "status": "completed", "progress": { "percent": 100, "message": "Complete" }, "created_on": "{{CREATED_ON}}", "modified_on": "{{MODIFIED_ON}}", "checksum": "fc2012e3142a4c7098c9cda1caa53bc3", "source": { "input": "grid", "entity": "solar", "date_time": "2025-07-01T19:00:00Z", "bands": ["irradiance.surface.relative"], "source_lad_grid_id": "your-leaf-area-density-grid-id", "operation": "irradiance", "source_grid_checksum": "a6ce61726c234aa38d4dac80345a8dad", "extinction_coefficient": 0.5 }, "modifications": [], "bands": [ { "key": "irradiance.surface.relative", "name": "Relative Irradiance on Surface", "description": "Relative irradiance on the terrain surface [0-1] beneath the canopy.", "type": "continuous", "unit": null, "index": 0, "nodata": null, "summary": null } ], "georeference": { "crs": "EPSG:32611", "transform": [1.0, 0.0, 720226.0, 0.0, -1.0, 5190646.0], "shape": [884, 1308] }, "error": null, "chunks": { "shape": [884, 884], "count": 2, "count_by_axis": { "y": 1, "x": 2 } }, "tags": []}To drape the surface over real terrain, add source_terrain_grid_id. Now slope
and aspect shade the ground too: sun-facing slopes brighten, shaded ones darken,
on top of the canopy shadows.
curl -X 'POST' \ 'https://api-v2-prod-nyvjyh5ywa-uw.a.run.app/domains/your-domain-id/grids/solar/irradiance/leaflux' \ -H 'accept: application/json' \ -H 'api-key: my-api-key' \ -H 'Content-Type: application/json' \ -d '{ "source_lad_grid_id": "your-leaf-area-density-grid-id", "source_terrain_grid_id": "your-topography-grid-id", "bands": ["irradiance.surface.relative"], "date_time": "2025-07-01T19:00:00Z", "name": "Surface irradiance (terrain-draped)"}'# Same imports and set_api_key as above. source_terrain_grid drapes the surface# over real terrain, so slope and aspect shade the result too. The terrain grid# must share the source grid's x/y lattice (build it with alignment target "grid").grid = ff.grids.create_irradiance_grid_from_leaflux( "your-leaf-area-density-grid-id", domain="your-domain-id", date_time=datetime(2025, 7, 1, 19, 0, tzinfo=timezone.utc), source_terrain_grid="your-topography-grid-id", bands=["irradiance.surface.relative"], name="Surface irradiance (terrain-draped)",)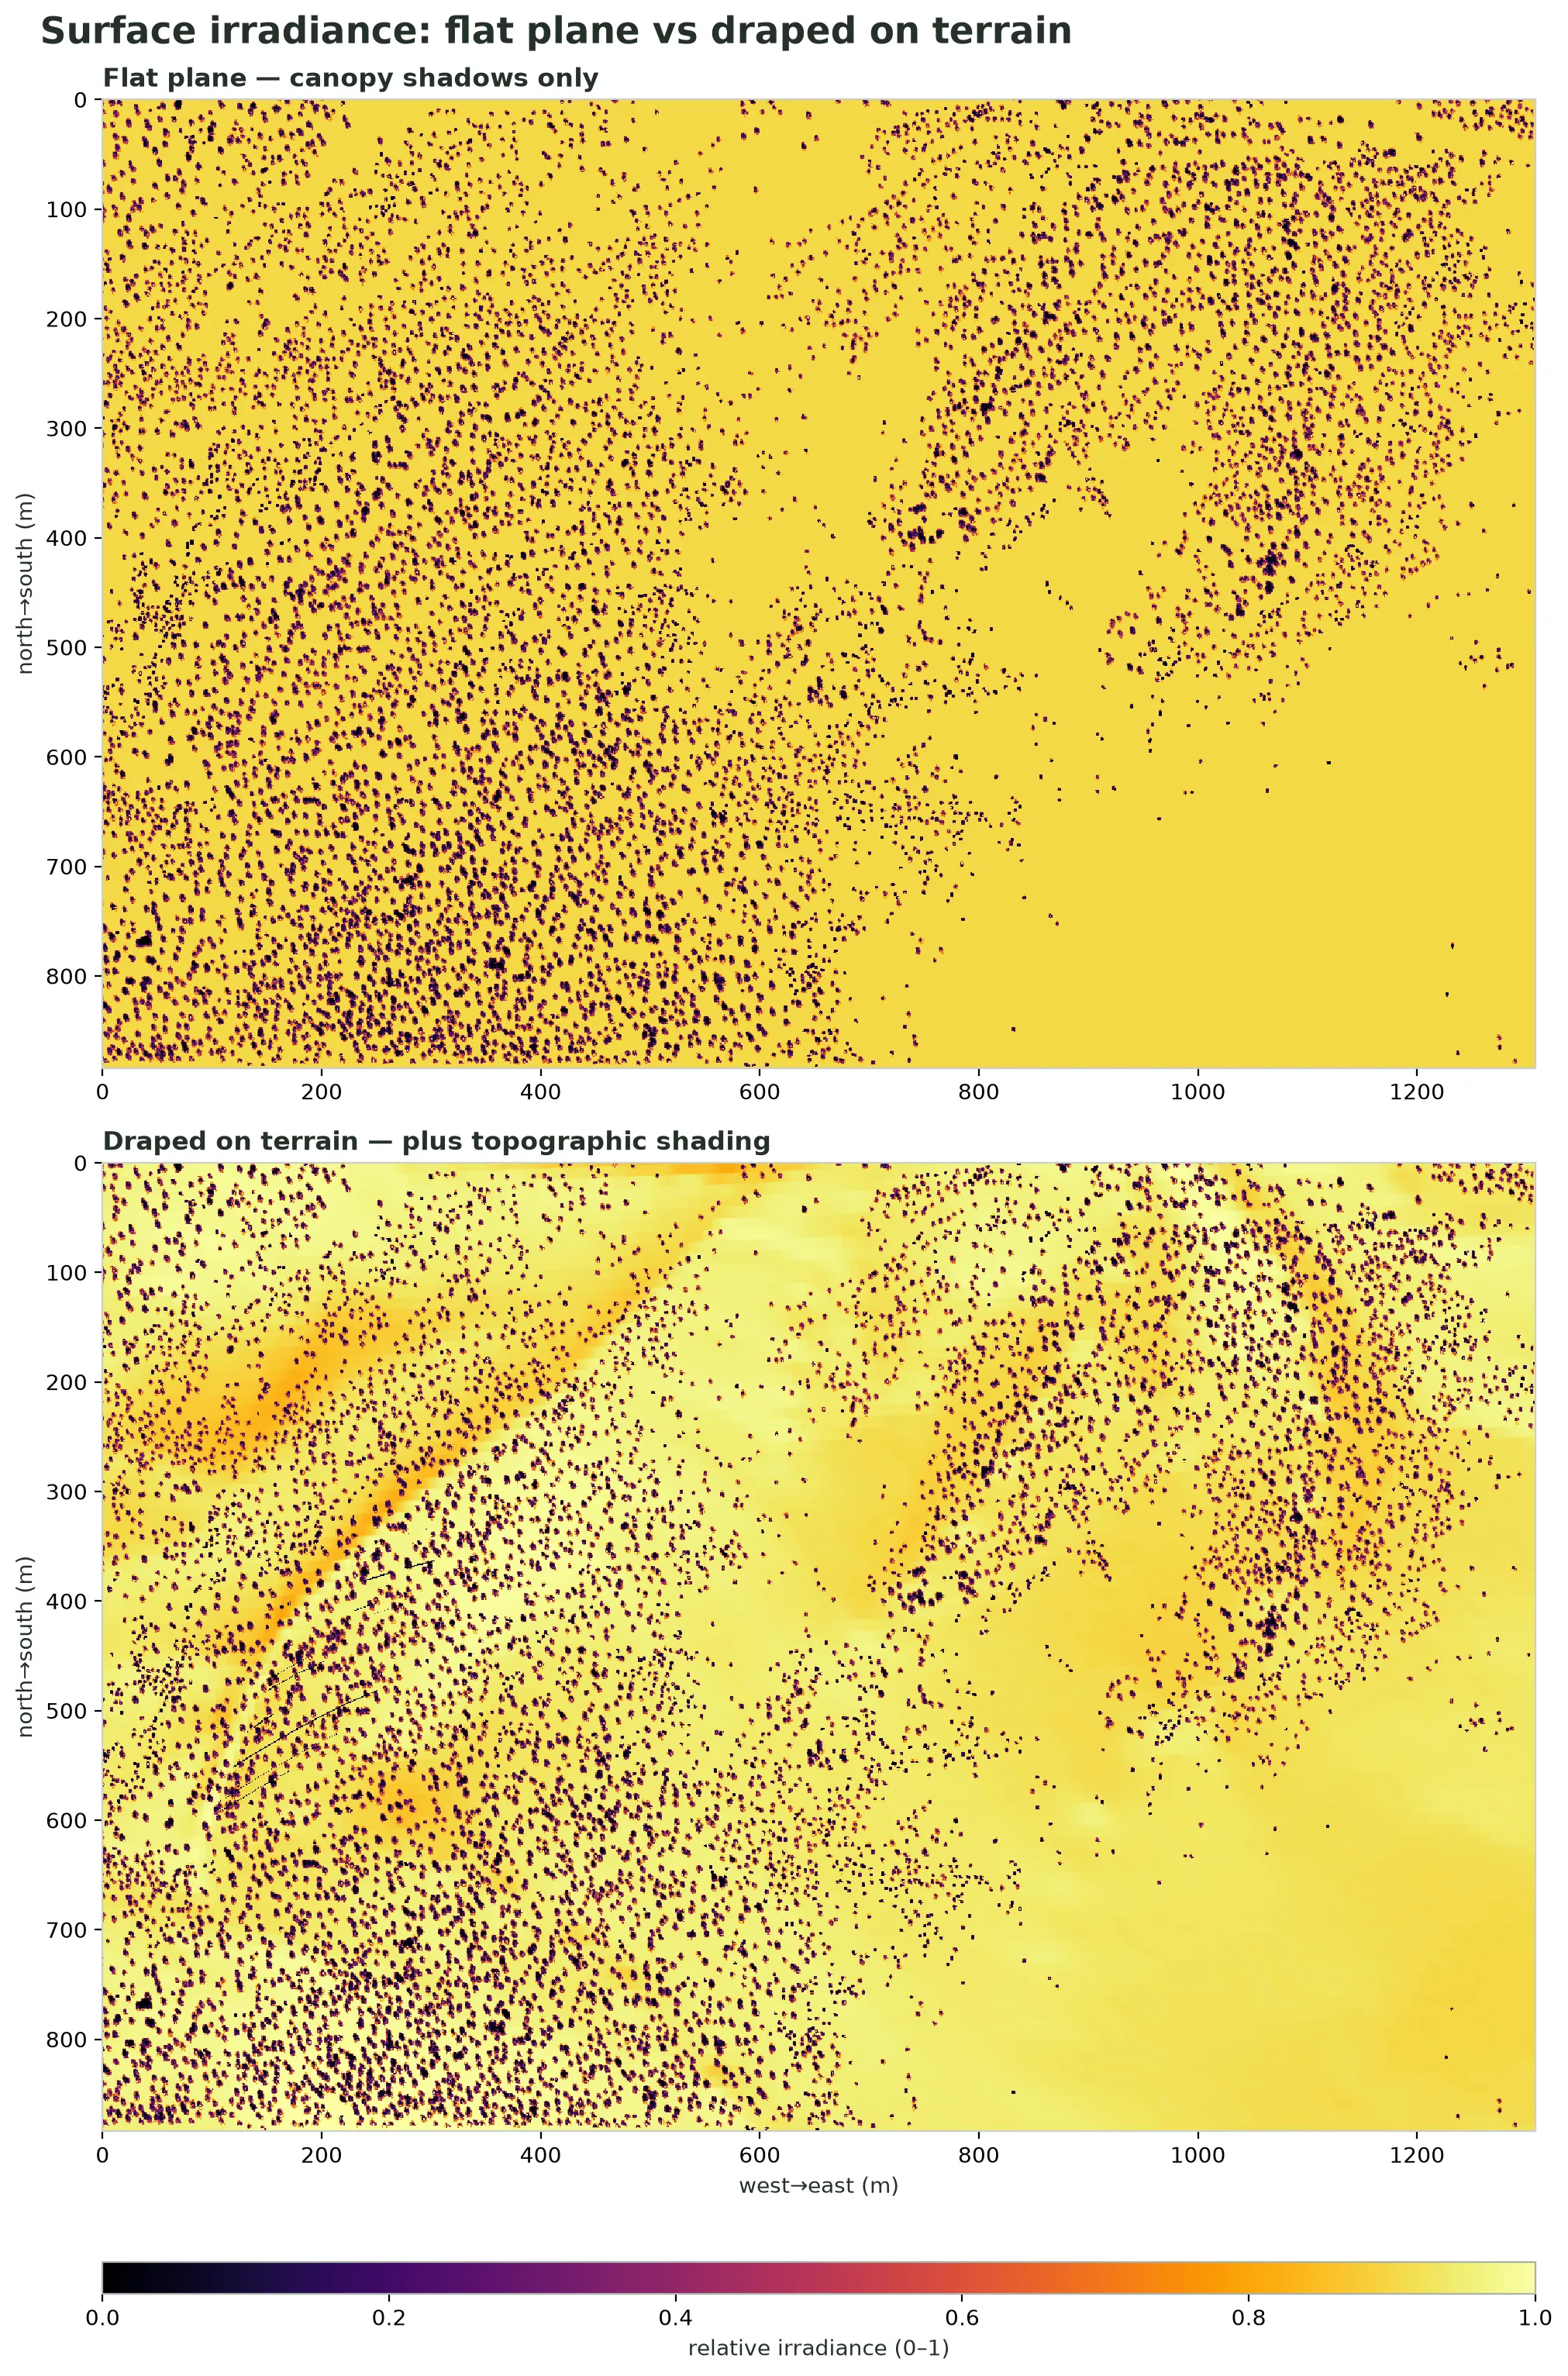
Surface irradiance over the Blue Mountain domain at midday. On the flat plane (top) the only shadows are the small dark specks each crown casts. Draped on terrain (bottom), slope and aspect add broad shading — sunlit ridges and shaded gullies — under the same canopy shadows. Same source grid, same sun; the terrain grid is the only difference.
Create a 3D canopy irradiance grid
Section titled “Create a 3D canopy irradiance grid”Ask for irradiance.canopy.relative and the grid is 3D: a relative
irradiance for every canopy voxel, from Beer–Lambert attenuation down through
the leaf area density above it.
curl -X 'POST' \ 'https://api-v2-prod-nyvjyh5ywa-uw.a.run.app/domains/your-domain-id/grids/solar/irradiance/leaflux' \ -H 'accept: application/json' \ -H 'api-key: my-api-key' \ -H 'Content-Type: application/json' \ -d '{ "source_lad_grid_id": "your-leaf-area-density-grid-id", "bands": ["irradiance.canopy.relative"], "date_time": "2025-07-01T19:00:00Z", "name": "Canopy irradiance (midday)"}'# Same imports and set_api_key as above. Ask for the canopy band and the grid# is 3D: a relative irradiance for every canopy voxel.grid = ff.grids.create_irradiance_grid_from_leaflux( "your-leaf-area-density-grid-id", domain="your-domain-id", date_time=datetime(2025, 7, 1, 19, 0, tzinfo=timezone.utc), bands=["irradiance.canopy.relative"], name="Canopy irradiance (midday)",){ "id": "your-irradiance-grid-id", "domain_id": "your-domain-id", "name": "Canopy irradiance (midday)", "description": "", "status": "completed", "progress": { "percent": 100, "message": "Complete" }, "created_on": "{{CREATED_ON}}", "modified_on": "{{MODIFIED_ON}}", "checksum": "9656fb0eacb54c0ea2d394d3d5985a4b", "source": { "source_grid_checksum": "a6ce61726c234aa38d4dac80345a8dad", "source_lad_grid_id": "your-leaf-area-density-grid-id", "extinction_coefficient": 0.5, "operation": "irradiance", "bands": ["irradiance.canopy.relative"], "date_time": "2025-07-01T19:00:00Z", "entity": "solar", "input": "grid" }, "modifications": [], "bands": [ { "key": "irradiance.canopy.relative", "name": "Relative Irradiance in Canopy", "description": "Per-voxel relative irradiance within the canopy [0-1], from Beer-Lambert attenuation through leaf area density.", "type": "continuous", "unit": null, "index": 0, "nodata": null, "summary": null } ], "georeference": { "crs": "EPSG:32611", "transform": [1.0, 0.0, 720226.0, 0.0, -1.0, 5190646.0], "shape": [33, 884, 1308], "z_resolution": 1.0, "z_origin": 0.0 }, "error": null, "chunks": { "shape": [33, 884, 884], "count": 2, "count_by_axis": { "z": 1, "x": 2, "y": 1 } }, "tags": []}The completed grid shares its source’s lattice exactly — same crs, transform,
and shape ([33, 884, 1308] here: 33 vertical layers over the 884 × 1308
horizontal grid of 1 m voxels). Every voxel that holds canopy gets a value in
[0, 1]; voxels outside the crowns are empty.
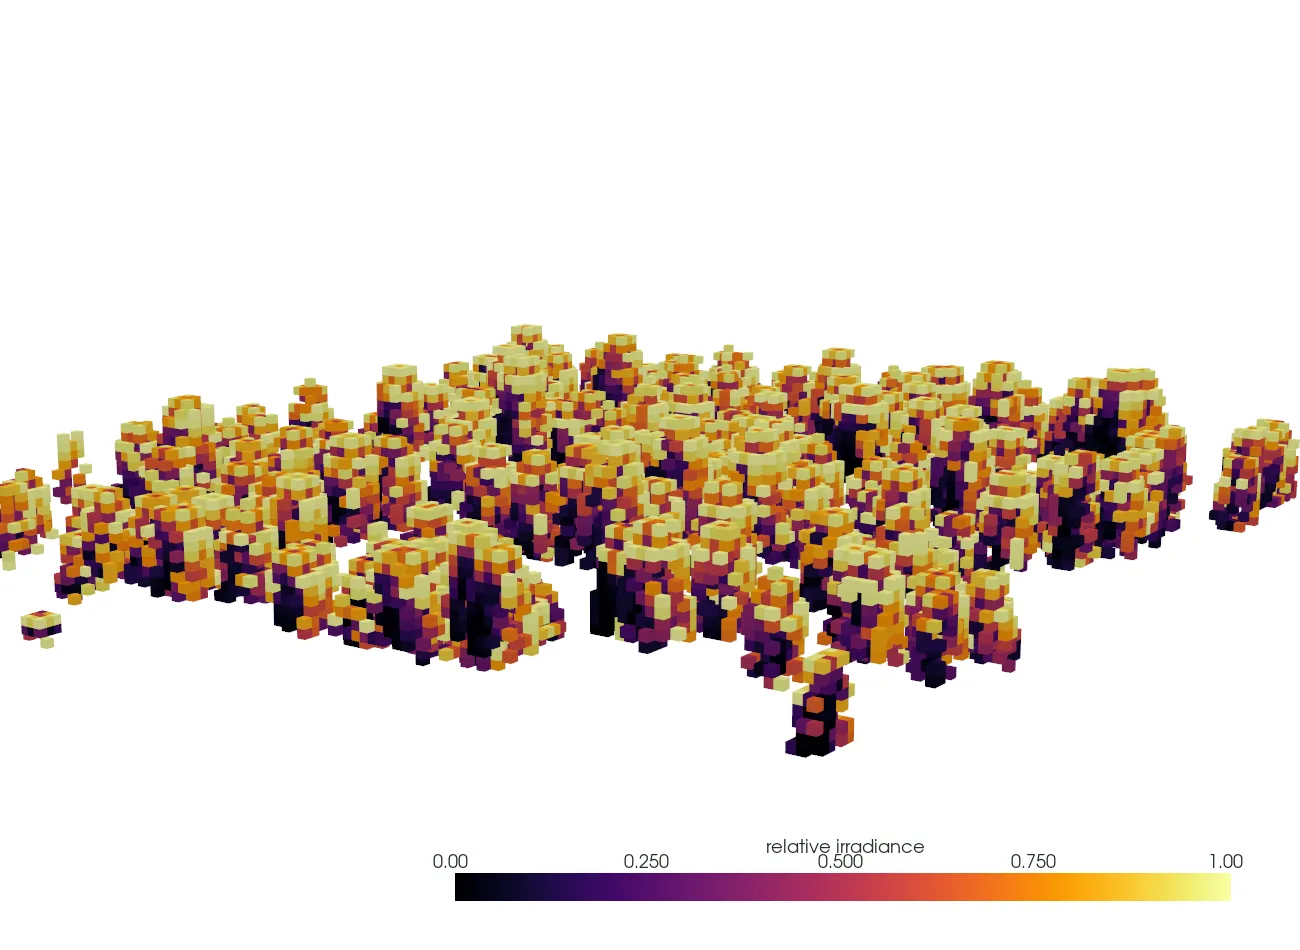
Per-voxel canopy irradiance over one patch of the Blue Mountain canopy grid at midday. Sunlit crown tops and outer faces are bright; the interior and underside of each crown, shaded by the foliage above, are dark. This is the Beer–Lambert attenuation the endpoint computes through leaf area density.
Request both bands at once
Section titled “Request both bands at once”List both bands to get them from a single job. Because the canopy band is
present, the grid is 3D: the canopy band fills the voxels and the surface
band sits on the ground plane (z=0), each an indexed band on the same lattice.
curl -X 'POST' \ 'https://api-v2-prod-nyvjyh5ywa-uw.a.run.app/domains/your-domain-id/grids/solar/irradiance/leaflux' \ -H 'accept: application/json' \ -H 'api-key: my-api-key' \ -H 'Content-Type: application/json' \ -d '{ "name": "Midday irradiance", "description": "Relative canopy and surface irradiance.", "tags": ["solar", "irradiance"], "source_lad_grid_id": "your-leaf-area-density-grid-id", "source_terrain_grid_id": "your-topography-grid-id", "bands": ["irradiance.canopy.relative", "irradiance.surface.relative"], "date_time": "2025-07-01T19:00:00Z", "extinction_coefficient": 0.5}'# Same imports and set_api_key as above. List both bands to get them from one# job. Because the canopy band is present, the grid is 3D: the canopy band fills# the voxels, and the surface band sits on the ground plane (z=0).grid = ff.grids.create_irradiance_grid_from_leaflux( "your-leaf-area-density-grid-id", domain="your-domain-id", date_time=datetime(2025, 7, 1, 19, 0, tzinfo=timezone.utc), source_terrain_grid="your-topography-grid-id", bands=["irradiance.canopy.relative", "irradiance.surface.relative"], extinction_coefficient=0.5, name="Midday irradiance", description="Relative canopy and surface irradiance.", tags=["solar", "irradiance"],){ "id": "your-irradiance-grid-id", "domain_id": "your-domain-id", "name": "Midday irradiance", "description": "Relative canopy and surface irradiance.", "status": "completed", "progress": { "percent": 100, "message": "Complete" }, "created_on": "{{CREATED_ON}}", "modified_on": "{{MODIFIED_ON}}", "checksum": "df4d467b3a8c4fe192439f83fb969a6a", "source": { "input": "grid", "entity": "solar", "date_time": "2025-07-01T19:00:00Z", "bands": ["irradiance.canopy.relative", "irradiance.surface.relative"], "source_lad_grid_id": "your-leaf-area-density-grid-id", "operation": "irradiance", "source_grid_checksum": "a6ce61726c234aa38d4dac80345a8dad", "source_terrain_grid_id": "your-topography-grid-id", "extinction_coefficient": 0.5 }, "modifications": [], "bands": [ { "key": "irradiance.canopy.relative", "name": "Relative Irradiance in Canopy", "description": "Per-voxel relative irradiance within the canopy [0-1], from Beer-Lambert attenuation through leaf area density.", "type": "continuous", "unit": null, "index": 0, "nodata": null, "summary": null }, { "key": "irradiance.surface.relative", "name": "Relative Irradiance on Surface", "description": "Relative irradiance on the terrain surface [0-1] beneath the canopy.", "type": "continuous", "unit": null, "index": 1, "nodata": null, "summary": null } ], "georeference": { "crs": "EPSG:32611", "transform": [1.0, 0.0, 720226.0, 0.0, -1.0, 5190646.0], "shape": [33, 884, 1308], "z_resolution": 1.0, "z_origin": 0.0 }, "error": null, "chunks": { "shape": [33, 884, 884], "count": 2, "count_by_axis": { "z": 1, "y": 1, "x": 2 } }, "tags": ["solar", "irradiance"]}Reach for a surface-only request when you want a 2D map or need to feed a 2D consumer; reach for a combined request when you want both fields on one grid in one job.
Tune the result
Section titled “Tune the result”Two inputs change what any of these grids says. Each is worth a deliberate choice.
date_time — where the sun is
Section titled “date_time — where the sun is”date_time is a UTC instant. It sets the sun’s azimuth and elevation, which set
the direction light travels through the canopy and where shadows fall. Move it
earlier or later in the day and the whole field shifts. Blue Mountain is UTC−6
in summer, so 2025-07-01T14:00:00Z is 08:00 local — the sun low in the east —
while 2025-07-01T19:00:00Z is 13:00 local, near solar noon.
curl -X 'POST' \ 'https://api-v2-prod-nyvjyh5ywa-uw.a.run.app/domains/your-domain-id/grids/solar/irradiance/leaflux' \ -H 'accept: application/json' \ -H 'api-key: my-api-key' \ -H 'Content-Type: application/json' \ -d '{ "source_lad_grid_id": "your-leaf-area-density-grid-id", "bands": ["irradiance.canopy.relative"], "date_time": "2025-07-01T14:00:00Z", "name": "Canopy irradiance (morning)"}'# Same imports and set_api_key as above, a different UTC instant. Blue Mountain# is UTC-6 in summer, so 14:00Z is 08:00 local — the sun low in the east.grid = ff.grids.create_irradiance_grid_from_leaflux( "your-leaf-area-density-grid-id", domain="your-domain-id", date_time=datetime(2025, 7, 1, 14, 0, tzinfo=timezone.utc), bands=["irradiance.canopy.relative"], name="Canopy irradiance (morning)",)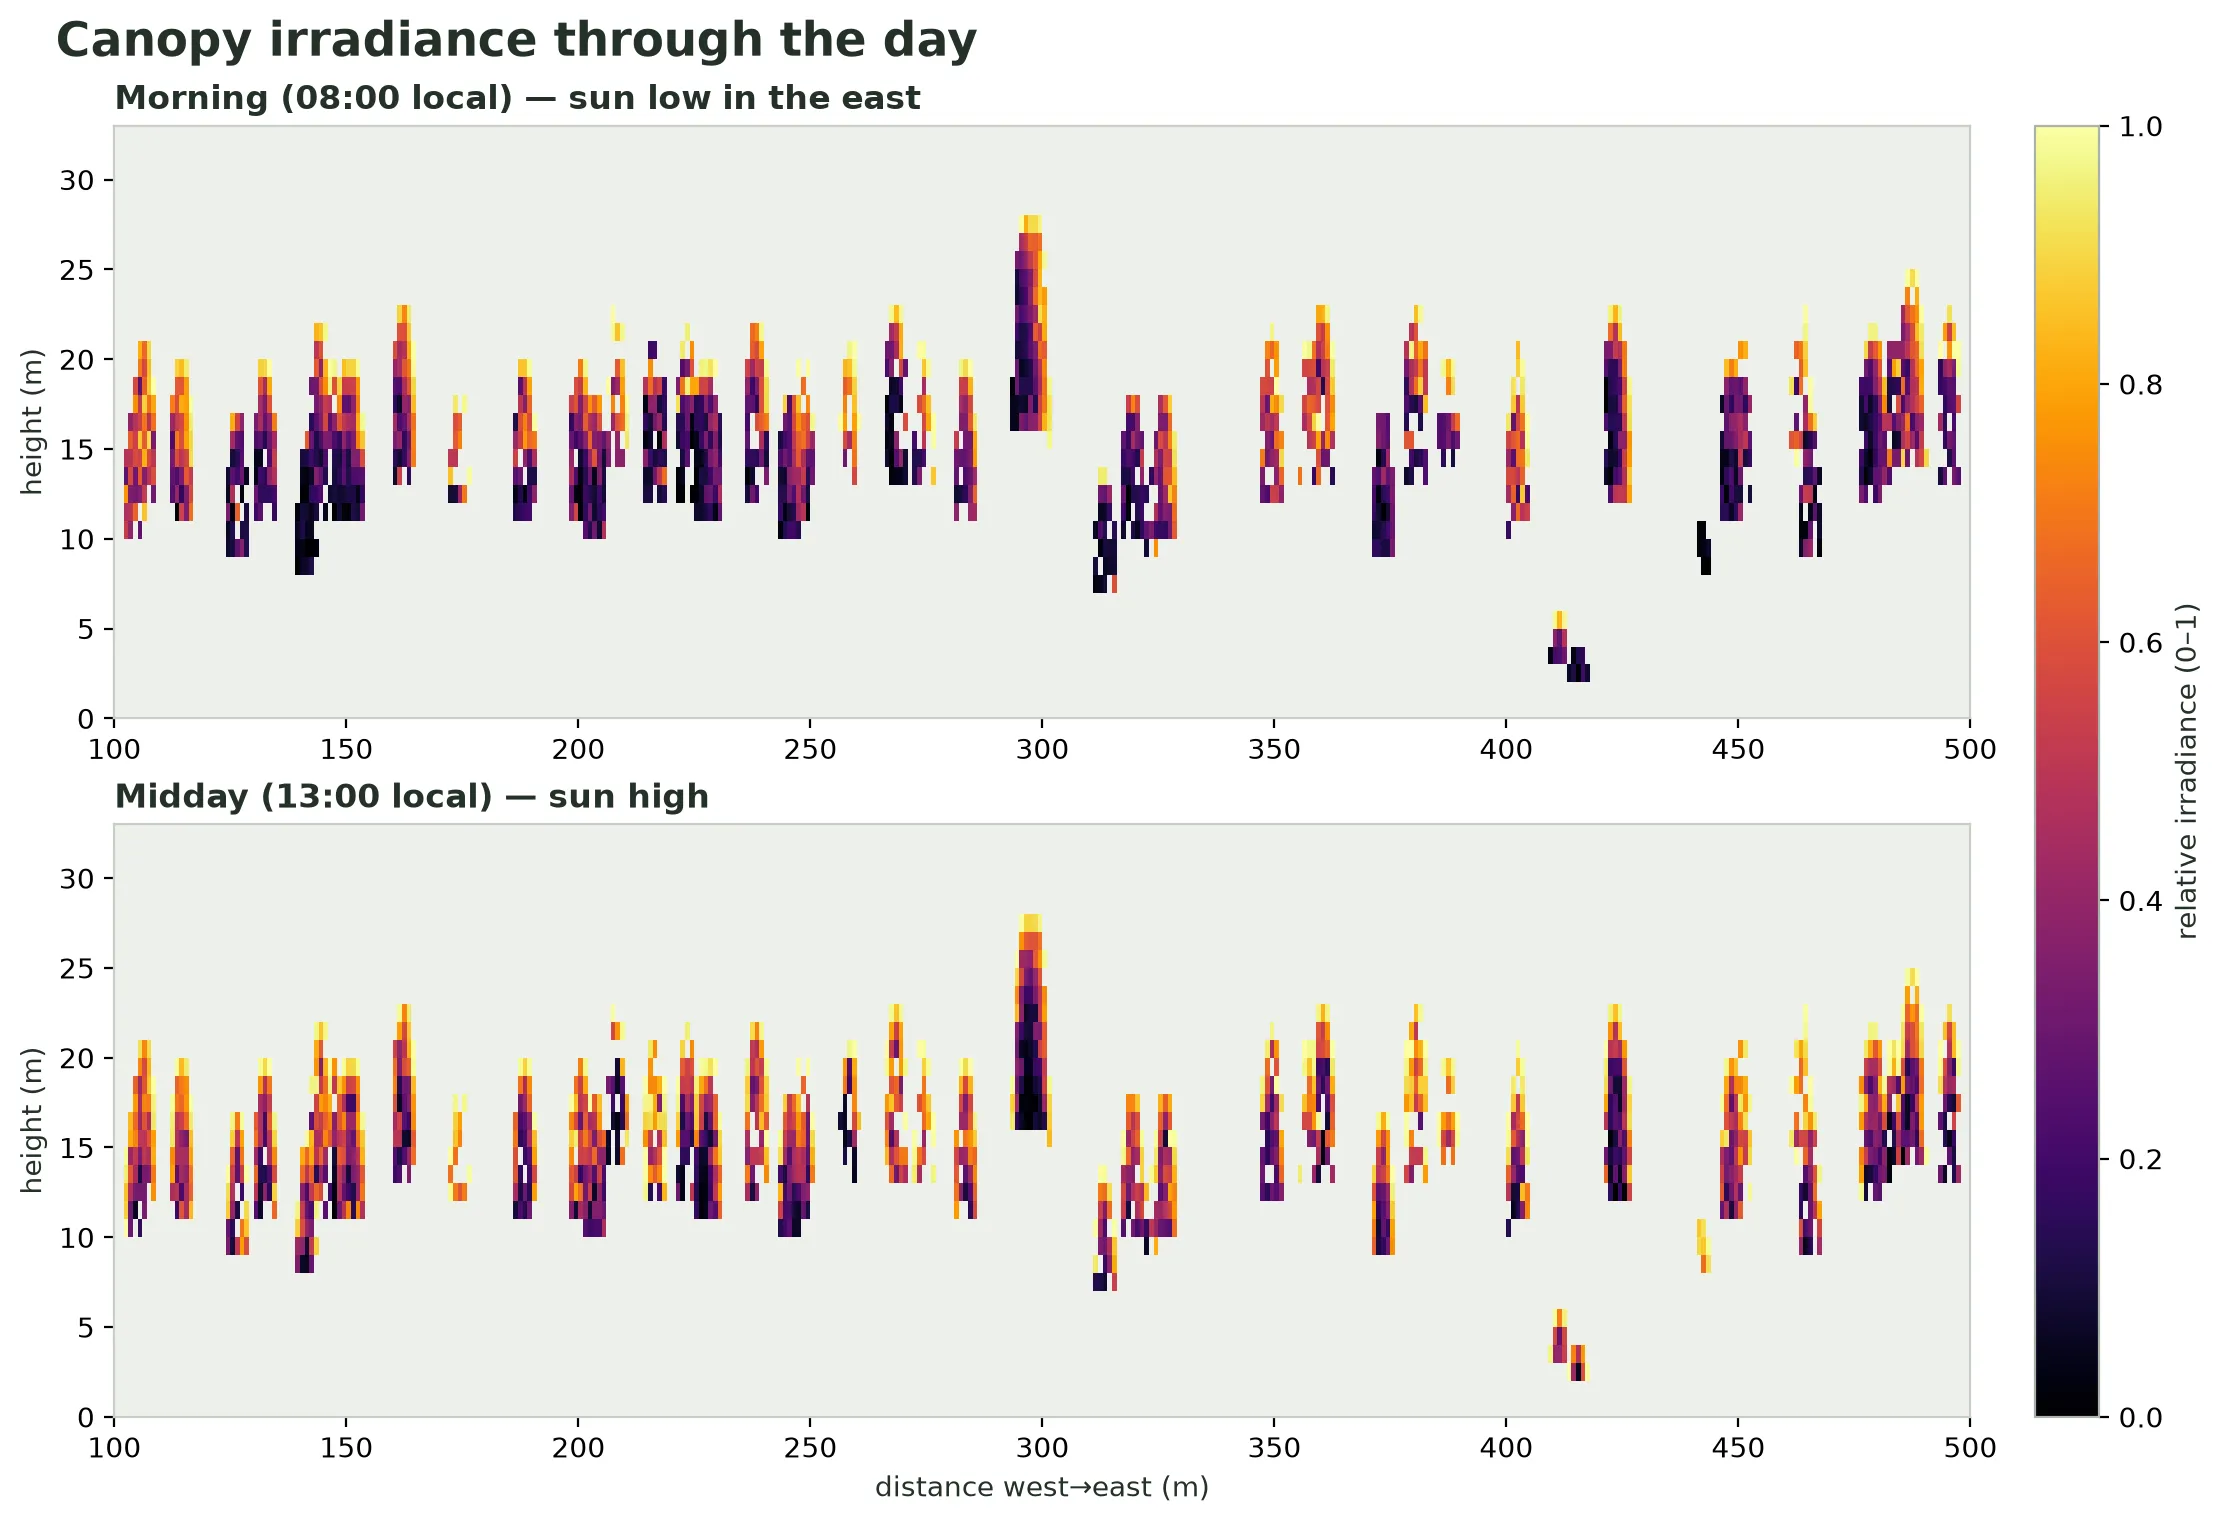
The same canopy at two times of day, as a vertical cross-section through one 5 m north–south band (so individual crowns stay legible). At midday the high sun lights the crowns further down; in the morning the low sun is intercepted higher up, leaving more of each crown’s interior in shadow. Crown tops stay bright in both.
extinction_coefficient — how fast light is absorbed
Section titled “extinction_coefficient — how fast light is absorbed”extinction_coefficient is the Beer–Lambert extn term: the larger it is, the
more each unit of leaf area density absorbs, so the faster irradiance falls with
depth into the canopy. It defaults to 0.5. Raise it to model a denser, more
light-absorbing canopy.
curl -X 'POST' \ 'https://api-v2-prod-nyvjyh5ywa-uw.a.run.app/domains/your-domain-id/grids/solar/irradiance/leaflux' \ -H 'accept: application/json' \ -H 'api-key: my-api-key' \ -H 'Content-Type: application/json' \ -d '{ "source_lad_grid_id": "your-leaf-area-density-grid-id", "bands": ["irradiance.canopy.relative"], "date_time": "2025-07-01T19:00:00Z", "extinction_coefficient": 1.5, "name": "Canopy irradiance (dense extinction)"}'# Same imports and set_api_key as above. A higher extinction_coefficient# attenuates light faster per unit of leaf area density, so less reaches the# lower canopy. The default is 0.5.grid = ff.grids.create_irradiance_grid_from_leaflux( "your-leaf-area-density-grid-id", domain="your-domain-id", date_time=datetime(2025, 7, 1, 19, 0, tzinfo=timezone.utc), bands=["irradiance.canopy.relative"], extinction_coefficient=1.5, name="Canopy irradiance (dense extinction)",)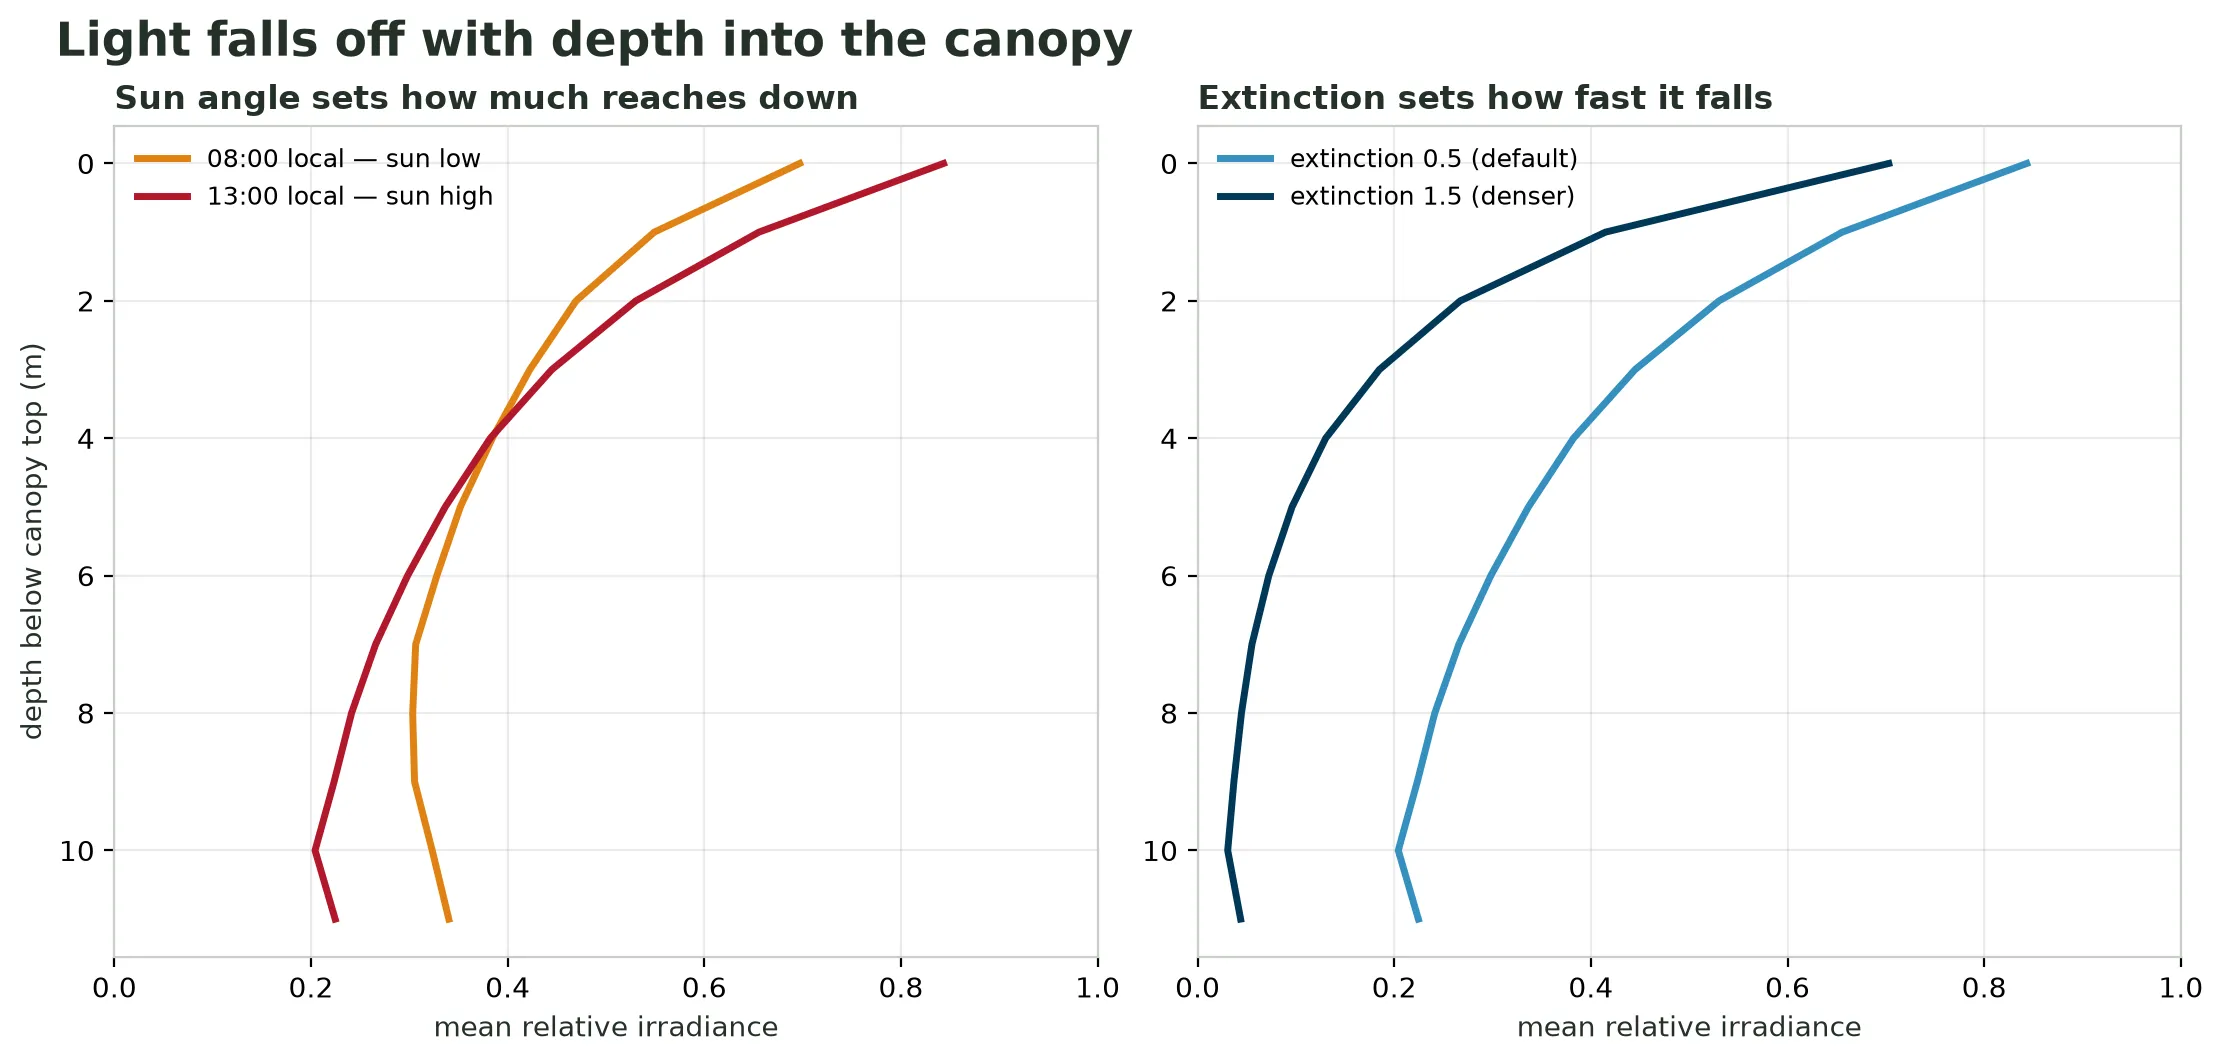
Mean relative irradiance against depth below the canopy top. Left: the higher midday sun drives more light into the upper canopy than the low morning sun. Right: a larger extinction_coefficient attenuates light faster, so the same canopy darkens sooner with depth. Both inputs reshape the whole profile, not just its top.
Read the values back
Section titled “Read the values back”Every irradiance grid is read the same way as any other — grid.to_numpy(band)
(or grid.to_xarray()), as in
Fetch and stream grid data.
The values are relative fractions in [0, 1].
- The surface band is a dense 2D
(y, x)raster — every ground cell carries a value.grid.to_numpy("irradiance.surface.relative")returns it directly. - The canopy band is a 3D
(z, y, x)array that is mostly empty — one value per canopy voxel,NaNelsewhere.grid.to_numpy("irradiance.canopy.relative")reassembles it for you, requesting the sparse encoding under the hood so a dense 1 m chunk doesn’t exceed the response size limit; the full script above shows it.
Common pitfalls
Section titled “Common pitfalls”- Source grid isn’t 3D or lacks
leaf_area_density. LeafLux needs the per-voxel leaf area density to attenuate light. Voxelize the inventory with"bands": ["leaf_area_density"]— a canopy grid built without that band, or a 2D grid, can’t be a source. - Terrain grid on a different lattice.
source_terrain_grid_idmust share the source grid’s CRS, origin, cell size, and shape. Align the 3DEP grid to the source grid, or resample it, before draping. - Source grid still
pending. Poll the source canopy grid tocompletedbefore this request; LeafLux reads its data, not just its metadata. - Treating the values as an energy flux. They are relative fractions in
[0, 1]— a share of open-sky irradiance — and carry no unit. Scale by an incoming-radiation figure yourself if you needW/m**2. - Reusing a grid after changing the source. The
source_grid_checksumrecords which source produced the result. Rebuild the irradiance grid if you rebuild the canopy grid. - Hitting your quota. A LeafLux request past your grid quota returns
429. Delete grids you no longer need, or request a higher quota.